Vodafone 2007 Annual Report Download - page 42
Download and view the complete annual report
Please find page 42 of the 2007 Vodafone annual report below. You can navigate through the pages in the report by either clicking on the pages listed below, or by using the keyword search tool below to find specific information within the annual report.-
 1
1 -
2
-
3
-
4
-
5
-
6
-
7
-
8
-
9
-
10
-
11
-
12
-
13
-
14
-
15
-
16
-
17
-
18
-
19
-
20
-
21
-
22
-
23
-
24
-
25
-
26
-
27
-
28
-
29
-
30
-
31
-
 32
32 -
 33
33 -
 34
34 -
 35
35 -
 36
36 -
 37
37 -
 38
38 -
 39
39 -
 40
40 -
 41
41 -
 42
42 -
 43
43 -
 44
44 -
 45
45 -
 46
46 -
 47
47 -
 48
48 -
 49
49 -
 50
50 -
 51
51 -
 52
52 -
53
-
54
-
55
-
56
-
57
-
58
-
59
-
60
-
61
-
62
-
63
-
64
-
65
-
66
-
67
-
68
-
69
-
70
-
71
-
72
-
73
-
74
-
75
-
76
-
77
-
78
-
79
-
80
-
81
-
82
-
83
-
84
-
85
-
86
-
87
-
88
-
89
-
90
-
91
-
92
-
93
-
94
-
95
-
96
-
97
-
98
-
99
-
100
-
101
-
102
-
103
-
104
-
105
-
106
-
107
-
108
-
109
-
110
-
111
-
112
-
113
-
114
-
115
-
116
-
117
-
118
-
119
-
120
-
121
-
122
-
123
-
124
-
125
-
126
-
127
-
128
-
129
-
130
-
131
-
132
-
133
-
134
-
135
-
136
-
137
-
138
-
139
-
140
-
141
-
142
-
143
-
144
-
145
-
146
-
147
-
148
-
149
-
150
-
151
-
152
-
153
-
154
-
155
-
156
-
157
-
158
-
159
-
160
-
161
-
162
-
163
-
164
 |
 |

40 Vodafone Group Plc Annual Report 2007
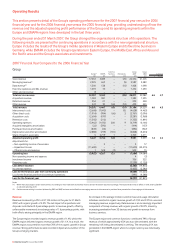
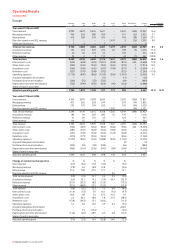
Operating Results
continued
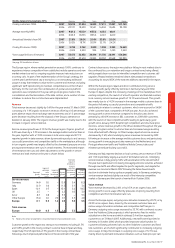
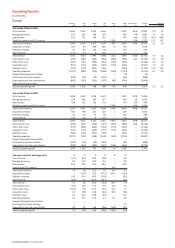
EMAPA Eastern Middle East, Associates Associates
Europe Africa & Asia Pacific US Other EMAPA % change
£m £m £m £m £m £m £ Organic
Year ended 31 March 2007
Voice revenue 2,051 2,096 942 5,089 40.0
Messaging revenue 271 142 254 667 46.9
Data revenue 70 26 42 138 60.5
Fixed line operator and DSL revenue −68 7 75 294.7
Total service revenue 2,392 2,332 1,245 5,969 42.3 20.4
Acquisition revenue 53 223 105 381 37.5
Retention revenue 19 −2 21 50.0
Other revenue 13 10 47 70 2.9
Total revenue 2,477 2,565 1,399 6,441 41.4 21.1
Interconnect costs (433) (364) (248) (1,045) 31.6
Other direct costs (314) (246) (224) (784) 77.4
Acquisition costs (219) (291) (167) (677) 45.0
Retention costs (78) (84) (50) (212) 52.5
Operating expenses (614) (509) (349) (1,472) 39.8
Acquired intangibles amortisation (285) (105) (2) (392) 152.9
Purchased licence amortisation (19) (17) (7) (43) (31.7)
Depreciation and other amortisation (331) (255) (193) (779) 29.4
Share of result in associates −−−2,077 642 2,719 13.4
Adjusted operating profit 184 694 159 2,077 642 3,756 16.0 24.3
Year ended 31 March 2006
Voice revenue 1,176 1,503 957 3,636
Messaging revenue 146 91 217 454
Data revenue 36 12 38 86
Fixed line operators and DSL revenue −19 −19
Total service revenue 1,358 1,625 1,212 4,195
Acquisition revenue 54 147 76 277
Retention revenue 13 −114
Other revenue 10 12 46 68
Total revenue 1,435 1,784 1,335 4,554
Interconnect costs (296) (251) (247) (794)
Other direct costs (77) (159) (206) (442)
Acquisition costs (148) (198) (121) (467)
Retention costs (51) (48) (40) (139)
Operating expenses (335) (359) (359) (1,053)
Acquired intangibles amortisation (121) (33) (1) (155)
Purchased licence amortisation (13) (34) (16) (63)
Depreciation and other amortisation (218) (179) (205) (602)
Share of result in associates −−−1,732 666 2,398
Adjusted operating profit 176 523 140 1,732 666 3,237
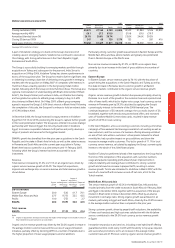
Change at constant exchange rates %%%%%
Voice revenue 80.3 56.7 5.3
Messaging revenue 88.7 74.8 25.4
Data revenue 100.1 142.6 17.2
Fixed line operators and DSL revenue – 294.3 –
Total service revenue 81.7 61.2 10.0
Acquisition revenue 1.4 78.0 43.0
Retention revenue 50.0 – 217.5
Other revenue 15.4 (7.8) 12.8
Total revenue 78.0 62.1 12.1
Interconnect costs 49.8 62.3 7.1
Other direct costs 316.4 73.2 15.8
Acquisition costs 53.9 70.8 45.0
Retention costs 59.3 106.7 31.1
Operating expenses 88.4 61.0 3.4
Acquired intangibles amortisation 135.5 222.2 78.6
Purchased licence amortisation 48.0 (47.1) (49.8)
Depreciation and other amortisation 55.9 56.1 1.6
Share of result in associates – – – 27.6 (2.3)
Adjusted operating profit 12.1 49.8 25.4 27.6 (2.3)