Vodafone 2007 Annual Report Download - page 39
Download and view the complete annual report
Please find page 39 of the 2007 Vodafone annual report below. You can navigate through the pages in the report by either clicking on the pages listed below, or by using the keyword search tool below to find specific information within the annual report.-
 1
1 -
2
-
3
-
4
-
5
-
6
-
7
-
8
-
9
-
10
-
11
-
12
-
13
-
14
-
15
-
16
-
17
-
18
-
19
-
20
-
21
-
22
-
23
-
24
-
25
-
26
-
27
-
28
-
 29
29 -
 30
30 -
 31
31 -
 32
32 -
 33
33 -
 34
34 -
 35
35 -
 36
36 -
 37
37 -
 38
38 -
 39
39 -
 40
40 -
 41
41 -
 42
42 -
 43
43 -
 44
44 -
 45
45 -
 46
46 -
 47
47 -
 48
48 -
 49
49 -
50
-
51
-
52
-
53
-
54
-
55
-
56
-
57
-
58
-
59
-
60
-
61
-
62
-
63
-
64
-
65
-
66
-
67
-
68
-
69
-
70
-
71
-
72
-
73
-
74
-
75
-
76
-
77
-
78
-
79
-
80
-
81
-
82
-
83
-
84
-
85
-
86
-
87
-
88
-
89
-
90
-
91
-
92
-
93
-
94
-
95
-
96
-
97
-
98
-
99
-
100
-
101
-
102
-
103
-
104
-
105
-
106
-
107
-
108
-
109
-
110
-
111
-
112
-
113
-
114
-
115
-
116
-
117
-
118
-
119
-
120
-
121
-
122
-
123
-
124
-
125
-
126
-
127
-
128
-
129
-
130
-
131
-
132
-
133
-
134
-
135
-
136
-
137
-
138
-
139
-
140
-
141
-
142
-
143
-
144
-
145
-
146
-
147
-
148
-
149
-
150
-
151
-
152
-
153
-
154
-
155
-
156
-
157
-
158
-
159
-
160
-
161
-
162
-
163
-
164
 |
 |

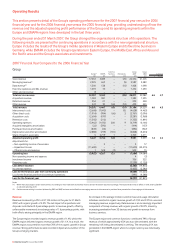
Vodafone Group Plc Annual Report 2007 37
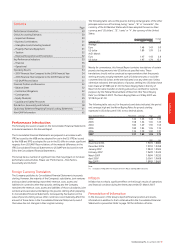
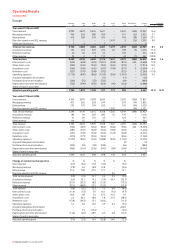
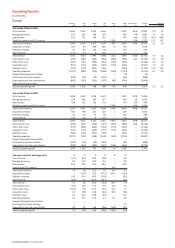
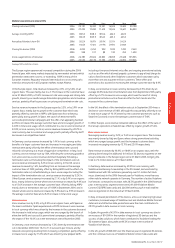
Mobile telecommunications KPIs Germany Italy Spain UK Other Europe
Closing customers (‘000) 2007 30,818 21,034 14,893 17,411 17,007 101,163
2006 29,191 18,490 13,521 16,304 15,692 93,198
Average monthly ARPU 2007 €21.2 €25.9 €35.2 £23.6 £20.1
2006 23.3 28.5 35.6 £24.0 £22.0
Annualised blended churn (%) 2007 21.8% 20.6% 26.4% 33.8% 26.6%
2006 20.2% 18.7% 20.9% 32.1% 24.2%
Closing 3G devices (‘000) 2007 3,720 3,762 2,890 1,938 2,353 14,663
2006 2,025 2,250 902 1,033 1,230 7,440
Voice usage (millions of minutes) 2007 33,473 32,432 30,414 31,736 28,491 156,546
2006 26,787 29,604 23,835 28,059 27,648 135,933
See page 159 for definition of terms
The Europe region, where market penetration exceeds 100%, continues to
experience intense competition from established mobile operators and new
market entrants as well as ongoing regulator imposed rate reductions on
incoming calls. As part of the implementation of the Group’s strategy, the
current year’s performance saw a strong focus on stimulating additional
usage in a way that enhances value to the customer and revenue, including
significant tariff repositioning to maintain competitiveness in the UK and
Germany. On the cost side, the centralisation of global service platform
operations was completed in the year, with good progress made in the
consolidation and harmonisation of the data centres, and a number of new
initiatives to reduce the cost structure were implemented.
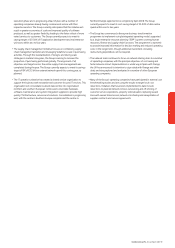
Revenue
Total revenue decreased slightly by 0.6% for the year ended 31 March 2007,
consisting of a 1.4% organic increase in revenue, offset by a 0.5 percentage
point adverse impact from exchange rate movements and a 1.5 percentage
point decrease resulting from the disposal of the Group’s operations in
Sweden in January 2006. The organic revenue growth was mainly due to the
increase in organic service revenue.
Service revenue growth was 0.1% for the Europe region. Organic growth of
2.0% was driven by a 7.7% increase in the average mobile customer base in
the year, together with a 17.0% increase in total voice usage and 27.1%
reported growth in data revenue, driven by innovative products and services,
successful promotions and competitive tariffs in the marketplace, although
in turn organic growth was largely offset by the downward pressure on voice
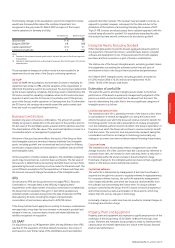
pricing and termination rate cuts in certain markets. The estimated impact
of termination rate cuts and other adjustments on the growth in service
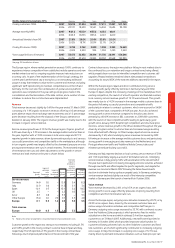
revenue and total revenue in the year is shown below.
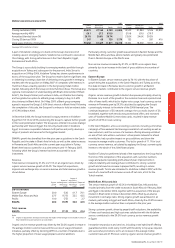
Estimated
impact of
termination
rate cuts
Impact of and other
exchange Impact of adjustments(1) Growth
Reported rates disposal Organic on revenue excluding
growth Percentage Percentage growth growth these items
% points points % % %
Service revenue
Germany (4.4) 0.5 – (3.9) 3.4 (0.5)
Italy (2.1) 0.6 – (1.5) 5.1 3.6
Spain 12.4 0.7 – 13.1 5.2 18.3
UK 2.5 – – 2.5 0.5 3.0
Arcor 8.7 0.8 – 9.5 – 9.5
Other Europe (7.6) 0.4 7.3 0.1 4.7 4.8
Europe 0.1 0.5 1.4 2.0 3.5 5.5
Total revenue
Europe (0.6) 0.5 1.5 1.4 3.2 4.6
Note:
(1) Revenue for certain arrangements is now presented net of associated direct costs
Customer growth in the region was strong in most markets, including 21.7%
and 16.9% growth in the closing contract customer base in Spain and Italy,
respectively. The UK reported a 7.7% growth in the closing contract base
following a much improved performance in the second half of the year.
Contract churn across the region was stable or falling in most markets due to
the continued focus on retention and longer contract terms being offered,
whilst prepaid churn rose due to intensified competition and customer self-
upgrades. Prepaid markets remained vibrant, with prepaid net additions
accounting for around 65% of the total net additions reported for the region.
Within the Europe region, Spain and Arcor contributed strong service
revenue growth, partly offset by declines in Germany, Italy and Other
Europe. In Spain, despite the increasing challenge in the marketplace from
existing competitors, the launch of a fourth operator and branded resellers,
local currency service revenue growth of 13.1% was achieved. This growth
was mainly due to a 14.2% increase in the average mobile customer base in
the period following successful promotions and competitive tariffs,
particularly in relation to contract customers, which now account for 54.8%
of the customer base, compared to 49.6% last year. Arcor also achieved
strong growth in service revenue compared to the prior year, driven
primarily by a 60.0% increase in DSL customers to 2,081,000 customers,
with the launch of new competitive tariffs leading to particularly good
growth since January 2007. Despite high competition and structural price
declines, service revenue growth in the UK accelerated throughout the year,
driven by a higher contract customer base and increased usage resulting
from refreshed tariff offerings. In Other Europe, reported service revenue
decreased by 7.6%, whilst underlying service revenue increased by 4.8%
following an increase in the average mobile customer base, and particularly
strong growth in messaging and data revenue in the Netherlands and
Portugal where new tariffs and Vodafone Mobile Connect data card
initiatives proved particularly successful.
Germany and Italy reported declines in local currency service revenue of 3.9%
and 1.5% respectively, largely as a result of termination rate cuts. Underlying
service revenue in Italy grew by 3.6%, with acceleration in the second half of
the year due in particular to increasing messaging and voice volumes, achieved
through new tariffs and offers targeted to specific segments, and despite the
revenue loss incurred in March 2007 following the Italian Government’s
decision to eliminate the top up fee on prepaid cards. In Germany, underlying
service revenue declined slightly as a result of the intensely competitive
market in Germany and the launch of new tariffs in October 2006.
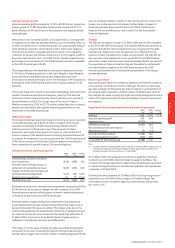
Voice revenue
Voice revenue decreased by 2.6%, or by 0.7% on an organic basis, with
strong growth in voice usage offset by pressures on pricing resulting from
competition and from termination rate cuts.
Across the Europe region, outgoing voice minutes increased by 20.7%, or by
22.3% on an organic basis, driven by the increased customer base and
various usage stimulation initiatives and competitive tariff ranges. In
Germany, outgoing voice usage increased by 35.7%, with continued success
from the Vodafone Zuhause product, which promotes fixed to mobile
substitution in the home and which achieved 2.4 million registered
customers as at 31 March 2007. Additionally, new tariffs were launched in
Germany in October 2006, which provided improved value bundles for
customers allowing unlimited calls to other Vodafone customers and fixed
line customers, all of which significantly contributed to increasing outgoing
voice usage. In Italy, the increase in outgoing voice usage of 12.1% was
mainly driven by demand stimulation initiatives such as fixed price per call
PerformancePerformance