Vodafone 2007 Annual Report Download - page 54
Download and view the complete annual report
Please find page 54 of the 2007 Vodafone annual report below. You can navigate through the pages in the report by either clicking on the pages listed below, or by using the keyword search tool below to find specific information within the annual report.-
 1
1 -
2
-
3
-
4
-
5
-
6
-
7
-
8
-
9
-
10
-
11
-
12
-
13
-
14
-
15
-
16
-
17
-
18
-
19
-
20
-
21
-
22
-
23
-
24
-
25
-
26
-
27
-
28
-
29
-
30
-
31
-
32
-
33
-
34
-
35
-
36
-
37
-
38
-
39
-
40
-
41
-
42
-
43
-
 44
44 -
 45
45 -
 46
46 -
 47
47 -
 48
48 -
 49
49 -
 50
50 -
 51
51 -
 52
52 -
 53
53 -
 54
54 -
 55
55 -
 56
56 -
 57
57 -
 58
58 -
 59
59 -
 60
60 -
 61
61 -
 62
62 -
 63
63 -
 64
64 -
65
-
66
-
67
-
68
-
69
-
70
-
71
-
72
-
73
-
74
-
75
-
76
-
77
-
78
-
79
-
80
-
81
-
82
-
83
-
84
-
85
-
86
-
87
-
88
-
89
-
90
-
91
-
92
-
93
-
94
-
95
-
96
-
97
-
98
-
99
-
100
-
101
-
102
-
103
-
104
-
105
-
106
-
107
-
108
-
109
-
110
-
111
-
112
-
113
-
114
-
115
-
116
-
117
-
118
-
119
-
120
-
121
-
122
-
123
-
124
-
125
-
126
-
127
-
128
-
129
-
130
-
131
-
132
-
133
-
134
-
135
-
136
-
137
-
138
-
139
-
140
-
141
-
142
-
143
-
144
-
145
-
146
-
147
-
148
-
149
-
150
-
151
-
152
-
153
-
154
-
155
-
156
-
157
-
158
-
159
-
160
-
161
-
162
-
163
-
164
 |
 |

52 Vodafone Group Plc Annual Report 2007
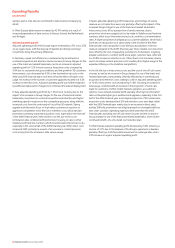
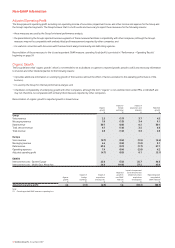
Financial Position and Resources
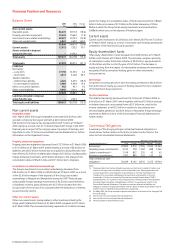
Balance Sheet
2007 2006 Change
£m £m %
Non-current assets
Intangible assets 56,272 69,118 (18.6)
Property, plant and equipment 13,444 13,660 (1.6)
Investments in associated undertakings 20,227 23,197 (12.8)
Other non-current assets 6,861 2,639 160.0
96,804 108,614 (10.9)
Current assets 12,813 7,532 70.1
Assets included in disposal
group held for sale – 10,592 –
Total assets 109,617 126,738 (13.5)
Total equity 67,293 85,312 (21.1)
Liabilities
Borrowings
– Long term 17,798 16,750 6.3
– Short term 4,817 3,448 39.7
Taxation liabilities
– Deferred tax liabilities 4,626 5,670 (18.4)
– Current taxation liabilities 5,088 4,448 14.4
Other non-current liabilities 954 951 0.3
Other current liabilities 9,041 7,616 18.7
42,324 38,883 8.8
Liabilities included in disposal
group held for sale – 2,543 –
Total equity and liabilities 109,617 126,738 (13.5)
Non-current assets
Intangible assets
At 31 March 2007, the Group’s intangible assets were £56.3 billion, with
goodwill comprising the largest element at £40.6 billion (2006:
£52.6 billion). The balance has decreased from £69.1 billion at 31 March
2006 mainly as a result of an £11.6 billion impairment charge in the 2007
financial year in respect of the carrying value of goodwill of Germany and
Italy. Refer to note 10 to the Consolidated Financial Statements for further
information on the impairment losses.
Property, plant and equipment
Property, plant and equipment decreased from £13.7 billion at 31 March 2006
to £13.4 billion at 31 March 2007, predominantly as a result of £3.4 billion of
additions and a £0.2 billion increase due to acquisitions during the year, more
than offset by £3.0 billion of depreciation charges, £0.5 billion of unfavourable
foreign exchange movements, a £0.3 billion decrease to the change in the
consolidation status in Bharti in India, and £0.1 billion due to disposals.
Investments in associated undertakings
The Group’s investments in associated undertakings decreased from
£23.2 billion at 31 March 2006 to £20.2 billion at 31 March 2007, as a result
of the £2.6 billion impact of the disposals of the Group’s associated
undertakings in Belgium and Switzerland during the 2007 financial year,
unfavourable foreign exchange movements of £2.3 billion and £0.8 billion
of dividends received, partly offset by the £2.7 billion increase from the
Group’s share of the results of its associates after the deductions of interest,
tax and minority interest.
Other non-current assets
Other non-current assets mainly relates to other investments held by the
Group, which totalled £5.9 billion at 31 March 2007 compared to £2.1 billion
at 31 March 2006. The movement primarily represents a £1.6 billion increase
due to the change in consolidation status of the Group’s investment in Bharti
Airtel in India, an increase of £1.0 billion in the listed share price of China
Mobile in which the Group has an equity investment, and investments in
SoftBank, which arose on the disposal of Vodafone Japan.
Current assets
Current assets increased to £12.8 billion at 31 March 2007 from £7.5 billion
at 31 March 2006, mainly as a result of increased cash holdings pending the
completion of the Hutchison Essar acquisition.
Equity shareholders’ funds
Total equity shareholders’ funds decreased from £85.3 billion at 31 March
2006 to £67.3 billion at 31 March 2007. The decrease comprises primarily
of redemptions under the B share scheme of £9.0 billion, equity dividends
of £3.6 billion and the loss for the year of £5.3 billion. The decrease in
equity resulting from the impact of unfavourable exchange rate movements
was partly offset by unrealised holding gains on other investments
discussed above.
Borrowings
Long term borrowings and short term borrowings increased to £22.6 billion
from £20.2 billion mainly as a result of funding required for the completion
of the Hutchison Essar acquisition.
Taxation liabilities
The deferred tax liability decreased from £5.7 billion at 31 March 2006 to
£4.6 billion at 31 March 2007, which together with the £0.3 billion increase
in deferred tax assets, arose mainly from a £0.7 billion tax credit to the
income statement, a net £0.3 billion in relation to discontinued and
deconsolidated operations, and £0.4 billion of favourable foreign exchange
movements. Refer to note 6 of the Consolidated Financial Statements for
further details.
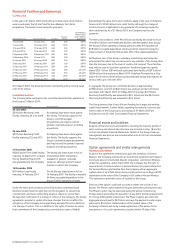
Contractual Obligations
A summary of the Group’s principal contractual financial obligations is
shown below. Further details on the items included can be found in the
notes to the Consolidated Financial Statements.
Payments due by period £m
Contractual obligations(1)(2) Total <1 year 1-3 years 3-5 years >5 years
Borrowings(3) 29,824 5,712 7,005 4,573 12,534
Operating lease commitments(4) 3,775 718 1,009 688 1,360
Capital commitments(4)(5) 1,149 827 235 42 45
Purchase commitments(4) 1,281 885 261 110 25
Total contractual cash
obligations(1) 36,029 8,142 8,510 5,413 13,964
Notes:
(1) The above table of contractual obligations excludes commitments in respect of options over
interests in Group businesses held by minority shareholders (see “Option agreements and
similar arrangements”) and obligations to pay dividends to minority shareholders (see
“Dividends from associated undertakings and investments, and dividends to minority
shareholders”). Disclosures required by Financial Accounting Standards Board (“FASB”)
Interpretation No. 45, “Guarantor’s Accounting and Disclosure Requirements for Guarantees,
Including Indirect Guarantees of Indebtedness of Others”, are provided in note 31 to the
Consolidated Financial Statements. The table also excludes deferred tax liabilities and
obligations under post employment benefit schemes, details of which are provided in notes 6
and 25 to the Consolidated Financial Statements, respectively.
(2) On 8 May 2007, the Group acquired companies with interests in Hutchison Essar. See page 136
for further details.
(3) See note 24 to the Consolidated Financial Statements.
(4) See note 30 to the Consolidated Financial Statements.
(5) Primarily related to network infrastructure.