Vodafone 2007 Annual Report Download - page 102
Download and view the complete annual report
Please find page 102 of the 2007 Vodafone annual report below. You can navigate through the pages in the report by either clicking on the pages listed below, or by using the keyword search tool below to find specific information within the annual report.-
 1
1 -
2
-
3
-
4
-
5
-
6
-
7
-
8
-
9
-
10
-
11
-
12
-
13
-
14
-
15
-
16
-
17
-
18
-
19
-
20
-
21
-
22
-
23
-
24
-
25
-
26
-
27
-
28
-
29
-
30
-
31
-
32
-
33
-
34
-
35
-
36
-
37
-
38
-
39
-
40
-
41
-
42
-
43
-
44
-
45
-
46
-
47
-
48
-
49
-
50
-
51
-
52
-
53
-
54
-
55
-
56
-
57
-
58
-
59
-
60
-
61
-
62
-
63
-
64
-
65
-
66
-
67
-
68
-
69
-
70
-
71
-
72
-
73
-
74
-
75
-
76
-
77
-
78
-
79
-
80
-
81
-
82
-
83
-
84
-
85
-
86
-
87
-
88
-
89
-
90
-
91
-
 92
92 -
 93
93 -
 94
94 -
 95
95 -
 96
96 -
 97
97 -
 98
98 -
 99
99 -
 100
100 -
 101
101 -
 102
102 -
 103
103 -
 104
104 -
 105
105 -
 106
106 -
 107
107 -
 108
108 -
 109
109 -
 110
110 -
 111
111 -
 112
112 -
113
-
114
-
115
-
116
-
117
-
118
-
119
-
120
-
121
-
122
-
123
-
124
-
125
-
126
-
127
-
128
-
129
-
130
-
131
-
132
-
133
-
134
-
135
-
136
-
137
-
138
-
139
-
140
-
141
-
142
-
143
-
144
-
145
-
146
-
147
-
148
-
149
-
150
-
151
-
152
-
153
-
154
-
155
-
156
-
157
-
158
-
159
-
160
-
161
-
162
-
163
-
164
 |
 |

100 Vodafone Group Plc Annual Report 2007
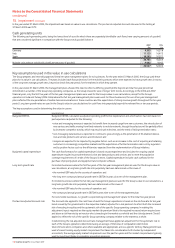
Notes to the Consolidated Financial Statements
continued
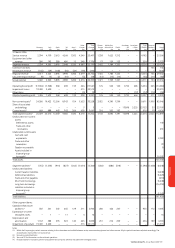
Other Total Eastern Middle East, Associates Associates Total Common
Germany Italy Spain UK Arcor(1) Europe – Europe Europe Africa & Asia Pacific – US – Other – EMAPA Functions Group
£m £m £m £m £m £m £m £m £m £m £m £m £m £m £m
31 March 2007
Service revenue 5,156 4,083 4,062 4,681 1,419 4,018 23,419 2,392 2,332 1,245 – – 5,969 – 29,388
Equipment and other
revenue 287 162 438 443 22 257 1,609 85 233 154 – – 472 – 2,081
Segment revenue 5,443 4,245 4,500 5,124 1,441 4,275 25,028 2,477 2,565 1,399 – – 6,441 – 31,469
Common functions 168 168
Intra-region revenue (123) (44) (106) (54) (27) (82) (436) – – – – – – – (436)
Regional revenue 5,320 4,201 4,394 5,070 1,414 4,193 24,592 2,477 2,565 1,399 – – 6,441 168 31,201
Less: Inter-region
revenue (9) (5) (3) (9) – (4) (30) (31) (9) (11) – – (51) (16) (97)
Group revenue 5,311 4,196 4,391 5,061 1,414 4,189 24,562 2,446 2,556 1,388 – – 6,390 152 31,104
Operating (loss)/profit (5,345) (3,325) 1,100 511 171 936 (5,952) 184 694 159 2,080 1,150 4,267 121 (1,564)
Impairment losses 6,700 4,900 – – – – 11,600 – – – – – – – 11,600
Other items (1) – – – – – (1) – – – (3) (508) (511) 7 (505)
Adjusted operating profit 1,354 1,575 1,100 511 171 936 5,647 184 694 159 2,077 642 3,756 128 9,531
Non-current assets(2) 16,279 13,754 12,327 8,551 829 7,328 59,068 6,347 3,160 1,379 – – 10,886 5,989 75,943
Share of associated
undertakings – – – – – 8 8 – – – 17,486 2,697 20,183 36 20,227
Current assets(2) 779 849 483 884 238 698 3,931 367 455 223 – – 1,045 255 5,231
Total segment assets(2) 17,058 14,603 12,810 9,435 1,067 8,034 63,007 6,714 3,615 1,602 17,486 2,697 32,114 6,280 101,401
Unallocated
non-current assets:
Deferred tax assets 410
Trade and other
receivables 224
Unallocated current
assets:
Cash and cash
equivalents 7,481
Trade and other
receivables 80
Taxation recoverable 21
Total assets 109,617
Segment liabilities(2) (827) (1,449) (1,000) (940) (376) (1,125) (5,717) (843) (886) (403) – – (2,132) (1,927) (9,776)
Unallocated liabilities:
Current taxation
liabilities (5,088)
Deferred tax liabilities (4,626)
Trade and other payables (219)
Short term borrowings (4,817)
Long term borrowings (17,798)
Total liabilities (42,324)
Other segment items:
Capitalised fixed asset
additions(3) 425 421 547 661 189 489 2,732 435 574 251 – – 1,260 216 4,208
Expenditure on other
intangible assets – 26 – – – 6 32 – 276 – – – 276 – 308
Depreciation and
amortisation 1,063 556 449 930 144 586 3,728 349 272 194 – – 815 568 5,111
Impairment of goodwill 6,700 4,900 – – – – 11,600 – – – – – – – 11,600
Notes:
(1) Within the Europe region, certain revenues relating to Arcor have been reclassified between service revenue and equipment and other revenue. All prior periods have been adjusted accordingly. The
reclassification had no effect on total revenue.
(2) Excluding unallocated items.
(3) Includes additions to property, plant and equipment and computer software, included within intangible assets.
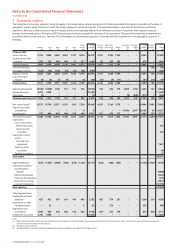
3. Segmental analysis
The Group has one business segment, being the supply of communications services and products. Primary segmental information is provided on the basis of
geographic regions, being the basis on which the Group manages its worldwide interests. The segmental analysis is provided for the Group’s continuing
operations. Revenue is determined by location of assets, which is not materially different from revenue by location of customer. Inter-segment sales are
charged at arms length prices. During the 2007 financial year, the Group changed the structure of its organisation. The results for all periods are presented in
accordance with the new structure. See note 29 for information on discontinued operations. Germany and Arcor together form the geographic segment of
Germany.