Vodafone 2007 Annual Report Download - page 123
Download and view the complete annual report
Please find page 123 of the 2007 Vodafone annual report below. You can navigate through the pages in the report by either clicking on the pages listed below, or by using the keyword search tool below to find specific information within the annual report.-
 1
1 -
2
-
3
-
4
-
5
-
6
-
7
-
8
-
9
-
10
-
11
-
12
-
13
-
14
-
15
-
16
-
17
-
18
-
19
-
20
-
21
-
22
-
23
-
24
-
25
-
26
-
27
-
28
-
29
-
30
-
31
-
32
-
33
-
34
-
35
-
36
-
37
-
38
-
39
-
40
-
41
-
42
-
43
-
44
-
45
-
46
-
47
-
48
-
49
-
50
-
51
-
52
-
53
-
54
-
55
-
56
-
57
-
58
-
59
-
60
-
61
-
62
-
63
-
64
-
65
-
66
-
67
-
68
-
69
-
70
-
71
-
72
-
73
-
74
-
75
-
76
-
77
-
78
-
79
-
80
-
81
-
82
-
83
-
84
-
85
-
86
-
87
-
88
-
89
-
90
-
91
-
92
-
93
-
94
-
95
-
96
-
97
-
98
-
99
-
100
-
101
-
102
-
103
-
104
-
105
-
106
-
107
-
108
-
109
-
110
-
111
-
112
-
 113
113 -
 114
114 -
 115
115 -
 116
116 -
 117
117 -
 118
118 -
 119
119 -
 120
120 -
 121
121 -
 122
122 -
 123
123 -
 124
124 -
 125
125 -
 126
126 -
 127
127 -
 128
128 -
 129
129 -
 130
130 -
 131
131 -
 132
132 -
 133
133 -
134
-
135
-
136
-
137
-
138
-
139
-
140
-
141
-
142
-
143
-
144
-
145
-
146
-
147
-
148
-
149
-
150
-
151
-
152
-
153
-
154
-
155
-
156
-
157
-
158
-
159
-
160
-
161
-
162
-
163
-
164
 |
 |
Vodafone Group Plc Annual Report 2007 121
Financials
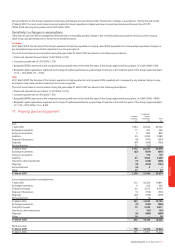
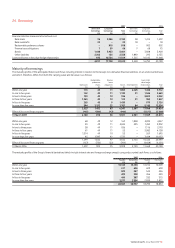
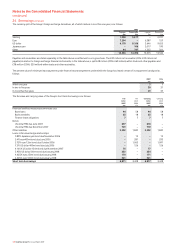
24. Borrowings
2007 2006
Short term Long term Short term Long term
borrowings borrowings Total borrowings borrowings Total
£m £m £m £m £m £m
Financial liabilities measured at amortised cost:
Bank loans 94 2,086 2,180 58 1,414 1,472
Bank overdrafts 23 – 23 18 – 18
Redeemable preference shares – 818 818 – 902 902
Finance lease obligations 75966 76875
Bonds 1,648 3,953 5,601 – 3,928 3,928
Other liabilities 2,202 156 2,358 1,840 295 2,135
Loans and bonds in fair value hedge relationships 843 10,726 11,569 1,525 10,143 11,668
4,817 17,798 22,615 3,448 16,750 20,198
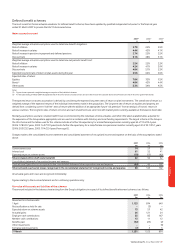
Maturity of borrowings
The maturity profile of the anticipated future cash flows including interest in relation to the Group’s non-derivative financial liabilities, on an undiscounted basis
and which, therefore, differs from both the carrying value and fair value, is as follows:
Redeemable Finance Loans in fair
preference lease value hedge
Bank loans shares obligations Bonds Other liabilities relationships Total
£m £m £m £m £m £m £m
Within one year 116 43 11 1,853 2,225 1,464 5,712
In one to two years 142 43 11 1,100 21 1,346 2,663
In two to three years 153 43 10 334 – 3,802 4,342
In three to four years 1,265 43 10 123 51 355 1,847
In four to five years 265 43 9 1,430 – 979 2,726
In more than five years 384 1,187 32 1,707 84 9,140 12,534
2,325 1,402 83 6,547 2,381 17,086 29,824
Effect of discount/financing rates (145) (584) (17) (946) – (5,517) (7,209)
31 March 2007 2,180 818 66 5,601 2,381 11,569 22,615
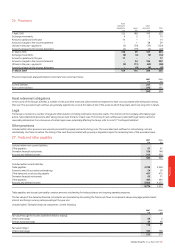
Within one year 68 49 12 167 1,858 2,093 4,247
In one to two years 53 49 11 2,044 295 1,450 3,902
In two to three years 58 49 11 936 – 1,116 2,170
In three to four years 61 49 11 55 – 3,982 4,158
In four to five years 1,314 49 10 55 – 267 1,695
In more than five years 45 1,387 42 1,375 – 7,428 10,277
1,599 1,632 97 4,632 2,153 16,336 26,449
Effect of discount/financing rates (127) (730) (22) (704) – (4,668) (6,251)
31 March 2006 1,472 902 75 3,928 2,153 11,668 20,198
The maturity profile of the Group’s financial derivatives (which include interest rate and foreign exchange swaps), using undiscounted cash flows, is as follows:
2007 2006
Payable Receivable Payable Receivable
£m £m £m £m
Within one year 15,163 15,163 14,012 14,009
In one to two years 611 626 609 600
In two to three years 503 587 545 556
In three to four years 403 398 456 523
In four to five years 400 387 332 315
In more than five years 3,577 3,596 2,839 2,851
20,657 20,757 18,793 18,854