Vodafone 2007 Annual Report Download - page 125
Download and view the complete annual report
Please find page 125 of the 2007 Vodafone annual report below. You can navigate through the pages in the report by either clicking on the pages listed below, or by using the keyword search tool below to find specific information within the annual report.-
 1
1 -
2
-
3
-
4
-
5
-
6
-
7
-
8
-
9
-
10
-
11
-
12
-
13
-
14
-
15
-
16
-
17
-
18
-
19
-
20
-
21
-
22
-
23
-
24
-
25
-
26
-
27
-
28
-
29
-
30
-
31
-
32
-
33
-
34
-
35
-
36
-
37
-
38
-
39
-
40
-
41
-
42
-
43
-
44
-
45
-
46
-
47
-
48
-
49
-
50
-
51
-
52
-
53
-
54
-
55
-
56
-
57
-
58
-
59
-
60
-
61
-
62
-
63
-
64
-
65
-
66
-
67
-
68
-
69
-
70
-
71
-
72
-
73
-
74
-
75
-
76
-
77
-
78
-
79
-
80
-
81
-
82
-
83
-
84
-
85
-
86
-
87
-
88
-
89
-
90
-
91
-
92
-
93
-
94
-
95
-
96
-
97
-
98
-
99
-
100
-
101
-
102
-
103
-
104
-
105
-
106
-
107
-
108
-
109
-
110
-
111
-
112
-
113
-
114
-
 115
115 -
 116
116 -
 117
117 -
 118
118 -
 119
119 -
 120
120 -
 121
121 -
 122
122 -
 123
123 -
 124
124 -
 125
125 -
 126
126 -
 127
127 -
 128
128 -
 129
129 -
 130
130 -
 131
131 -
 132
132 -
 133
133 -
 134
134 -
 135
135 -
136
-
137
-
138
-
139
-
140
-
141
-
142
-
143
-
144
-
145
-
146
-
147
-
148
-
149
-
150
-
151
-
152
-
153
-
154
-
155
-
156
-
157
-
158
-
159
-
160
-
161
-
162
-
163
-
164
 |
 |

Vodafone Group Plc Annual Report 2007 123
Financials
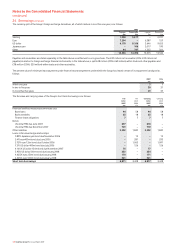
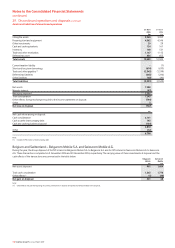
The fair value and carrying value of the Group’s long term borrowings is as follows:
Fair Fair Carrying Carrying
value value value value
2007 2006 2007 2006
£m £m £m £m
Financial liabilities measured at amortised cost:
Bank loans 2,086 1,414 2,086 1,414
Redeemable preference shares 818 902 818 902
Finance lease obligations 59 68 59 68
Bonds:
US dollar FRN due June 2007 –1,064 –1,064
US dollar FRN due December 2007 –859 –867
Euro FRN due July 2008 849 873 858 875
Euro FRN due February 2009 102 –102 –
Euro FRN due February 2010 204 –205 –
US dollar FRN due June 2011 224 201 178 202
Euro FRN due January 2012 683 –685 –
Euro FRN due January 2012 205 –197 –
US dollar FRN due February 2012 254 –255 –
Euro FRN due September 2013 582 –579 –
5.125% euro 500m bond due April 2015 350 366 365 376
5% euro 750m bond due June 2018 515 540 529 544
Other liabilities 156 295 156 295
Loans in fair value hedge relationships:
4.161% US dollar 150m bond due November 2007 –86 –85
3.95% US dollar 500m bond due January 2008 –281 –281
4.625% euro 250m bond due January 2008 –178 –172
5.5% euro 400m bond due July 2008 32 34 34 34
6.25% sterling 250m bond due July 2008 251 257 249 255
6.25% sterling 150m bond due July 2008 151 154 149 145
6.65% US dollar 500m bond due May 2008 129 147 132 140
4.625% euro 500m bond due January 2008 –316 –355
4.0% euro 300m bond due January 2009 203 –204 –
4.25% euro 1.4bn bond due May 2009 950 990 965 1,008
4.25% euro 500m bond due May 2009 339 354 348 360
4.75% euro 3bn bond due May 2009 596 624 602 593
7.75% US dollar 2.75bn bond due February 2010 1,480 1,702 1,467 1,693
5.5% US dollar 750m bond due June 2011 385 428 390 430
5.35% US dollar 500m bond due February 2012 255 –256 –
3.625% euro 750m bond due November 2012 487 505 492 514
6.75% Australian dollar 265m bond due January 2013 108 –110 –
5.0% US dollar 1bn bond due December 2013 464 549 502 559
4.625% sterling 350m bond due September 2014 321 333 334 349
5.375% US dollar 500m bond due January 2015 250 307 249 274
5.375% US dollar 400m bond due January 2015 200 220 199 220
5.0% US dollar 750m bond due September 2015 423 419 375 415
5.75% US dollar 750m bond due March 2016 384 423 384 427
4.75% euro 300m bond due June 2016 204 –209 –
4.75% euro 200m bond due June 2016 136 –140 –
5.625% US dollar 1.3bn bond due February 2017 650 –661 –
4.625% US dollar 500m bond due July 2018 231 258 235 260
5.625% sterling 250m bond due December 2025 242 254 253 271
7.875% US dollar 750m bond due February 2030 441 499 481 542
5.9% sterling 450m bond due November 2032 454 477 451 480
6.25% US dollar 495m bond due November 2032 250 293 252 281
6.15% US dollar 1.2bn bond due February 2037 609 –603 –
Long term borrowings 17,712 16,670 17,798 16,750
Fair values are calculated using discounted cash flows with a discount rate based upon forward interest rates available to the Group at the balance sheet date.
Banks loans include a ZAR8 billion loan held by Vodafone Holdings SA Pty Limited (“VHSA”), which directly and indirectly owns the Group’s 50% interest in
Vodacom Group (Pty) Limited. VHSA has pledged its 100% equity shareholding in Vodafone Investments SA (“VISA”) as security for its loan obligations. The
terms and conditions of the pledge mean that should VHSA not meet all of its loan payment and performance obligations, the lenders may sell the equity
shareholding in its subsidiary VISA at market value to recover their losses, with any remaining sales proceeds being returned to VHSA. Vodafone International
Holdings BV and VISA have also guaranteed this loan with recourse only to the VHSA and Vodafone Telecommunications Investment SA (“VTISA”) shares they
have respectively pledged. The terms and conditions of the security arrangement mean the lenders may be able to sell these respective shares in preference
to the VISA shares held by VHSA. An arrangement has been put in place, where the Vodacom Group (Pty) Limited shares held by VHSA and VTISA are held in
an escrow account to ensure the shares cannot be sold to satisfy the pledge made by both companies. The maximum collateral provided is ZAR8.6 billion,
being the carrying value of the bank loan as at 31 March 2007.