Vodafone 2007 Annual Report Download - page 64
Download and view the complete annual report
Please find page 64 of the 2007 Vodafone annual report below. You can navigate through the pages in the report by either clicking on the pages listed below, or by using the keyword search tool below to find specific information within the annual report.-
 1
1 -
2
-
3
-
4
-
5
-
6
-
7
-
8
-
9
-
10
-
11
-
12
-
13
-
14
-
15
-
16
-
17
-
18
-
19
-
20
-
21
-
22
-
23
-
24
-
25
-
26
-
27
-
28
-
29
-
30
-
31
-
32
-
33
-
34
-
35
-
36
-
37
-
38
-
39
-
40
-
41
-
42
-
43
-
44
-
45
-
46
-
47
-
48
-
49
-
50
-
51
-
52
-
53
-
 54
54 -
 55
55 -
 56
56 -
 57
57 -
 58
58 -
 59
59 -
 60
60 -
 61
61 -
 62
62 -
 63
63 -
 64
64 -
 65
65 -
 66
66 -
 67
67 -
 68
68 -
 69
69 -
 70
70 -
 71
71 -
 72
72 -
 73
73 -
 74
74 -
75
-
76
-
77
-
78
-
79
-
80
-
81
-
82
-
83
-
84
-
85
-
86
-
87
-
88
-
89
-
90
-
91
-
92
-
93
-
94
-
95
-
96
-
97
-
98
-
99
-
100
-
101
-
102
-
103
-
104
-
105
-
106
-
107
-
108
-
109
-
110
-
111
-
112
-
113
-
114
-
115
-
116
-
117
-
118
-
119
-
120
-
121
-
122
-
123
-
124
-
125
-
126
-
127
-
128
-
129
-
130
-
131
-
132
-
133
-
134
-
135
-
136
-
137
-
138
-
139
-
140
-
141
-
142
-
143
-
144
-
145
-
146
-
147
-
148
-
149
-
150
-
151
-
152
-
153
-
154
-
155
-
156
-
157
-
158
-
159
-
160
-
161
-
162
-
163
-
164
 |
 |

62 Vodafone Group Plc Annual Report 2007
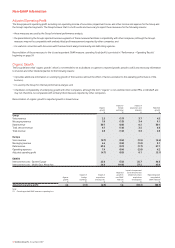
Non-GAAP Information
Adjusted Operating Profit
The Group presents operating profit excluding non-operating income of associates, impairment losses and other income and expense for the Group and
the Group's reported segments. The Group believes that it is both useful and necessary to report these measures for the following reasons:
•these measures are used by the Group for internal performance analysis;
•the presentation by the Group's reported business segments of these measures facilitates comparability with other companies, although the Group's
measures may not be comparable with similarly titled profit measurements reported by other companies; and
•it is useful in connection with discussion with the investment analyst community and debt rating agencies.
Reconciliation of these measures to the closest equivalent GAAP measure, operating (loss)/profit, is provided in “Performance – Operating Results”
beginning on page 34.
Organic Growth
The Group believes that “organic growth”, which is not intended to be a substitute, or superior to, reported growth, provides useful and necessary information
to investors and other interested parties for the following reasons:
•it provides additional information on underlying growth of the business without the effect of factors unrelated to the operating performance of the
business;
•it is used by the Group for internal performance analysis; and
•it facilitates comparability of underlying growth with other companies, although the term “organic” is not a defined term under IFRS, or US GAAP, and
may not, therefore, be comparable with similarly titled measures reported by other companies.
Reconciliation of organic growth to reported growth is shown below:
Impact of Impact of
Organic foreign acquisitions and Reported
growth exchange disposals growth
%%%%
Group
Voice revenue 2.5 (1.7) 3.7 4.5
Messaging revenue 7.0 (1.3) 3.4 9.1
Data revenue 30.7 (0.8) 0.2 30.1
Total service revenue 4.7 (1.6) 3.5 6.6
Total revenue 4.3 (1.6) 3.3 6.0
Europe
Voice revenue (0.7) (0.4) (1.5) (2.6)
Messaging revenue 4.6 (0.5) (1.0) 3.1
Data revenue 29.5 (0.7) (1.7) 27.1
Operating expenses 7.4 (0.4) (2.8) 4.2
Adjusted operating profit (4.7) (0.5) 0.1 (5.1)
EMAPA
Interconnect costs - Eastern Europe 23.8 (3.2) 25.7 46.3
Interconnect costs - Middle East, Africa Asia 26.8 (19.0) 37.2 45.0
Impact of impairment
Reported losses and amounts
Impact of Impact of growth in related to business Reported growth
Organic foreign acquisitions non-GAAP acquisitions in equivalent
growth exchange and disposals measure and disposals GAAP measure(1)
%%%%%%
Adjusted operating profit 4.2 (2.5) (0.3) 1.4 (90.3) (88.9)
Note:
(1) Closest equivalent GAAP measure is operating loss.