Vodafone 2007 Annual Report Download - page 49
Download and view the complete annual report
Please find page 49 of the 2007 Vodafone annual report below. You can navigate through the pages in the report by either clicking on the pages listed below, or by using the keyword search tool below to find specific information within the annual report.-
 1
1 -
2
-
3
-
4
-
5
-
6
-
7
-
8
-
9
-
10
-
11
-
12
-
13
-
14
-
15
-
16
-
17
-
18
-
19
-
20
-
21
-
22
-
23
-
24
-
25
-
26
-
27
-
28
-
29
-
30
-
31
-
32
-
33
-
34
-
35
-
36
-
37
-
38
-
 39
39 -
 40
40 -
 41
41 -
 42
42 -
 43
43 -
 44
44 -
 45
45 -
 46
46 -
 47
47 -
 48
48 -
 49
49 -
 50
50 -
 51
51 -
 52
52 -
 53
53 -
 54
54 -
 55
55 -
 56
56 -
 57
57 -
 58
58 -
 59
59 -
60
-
61
-
62
-
63
-
64
-
65
-
66
-
67
-
68
-
69
-
70
-
71
-
72
-
73
-
74
-
75
-
76
-
77
-
78
-
79
-
80
-
81
-
82
-
83
-
84
-
85
-
86
-
87
-
88
-
89
-
90
-
91
-
92
-
93
-
94
-
95
-
96
-
97
-
98
-
99
-
100
-
101
-
102
-
103
-
104
-
105
-
106
-
107
-
108
-
109
-
110
-
111
-
112
-
113
-
114
-
115
-
116
-
117
-
118
-
119
-
120
-
121
-
122
-
123
-
124
-
125
-
126
-
127
-
128
-
129
-
130
-
131
-
132
-
133
-
134
-
135
-
136
-
137
-
138
-
139
-
140
-
141
-
142
-
143
-
144
-
145
-
146
-
147
-
148
-
149
-
150
-
151
-
152
-
153
-
154
-
155
-
156
-
157
-
158
-
159
-
160
-
161
-
162
-
163
-
164
 |
 |

Vodafone Group Plc Annual Report 2007 47
PerformancePerformance
The Europe region experienced increased competition during the 2006
financial year, with many markets impacted by new market entrants whilst
penetration rates were close to, or exceeding, 100% in many of the
European markets. Regulator-imposed rate reductions on incoming calls
were also announced in all European markets except Albania.
In the Europe region, total revenue increased by 4.7%, or by 5.6% on an
organic basis. This was mainly due to a 7.1% increase in the customer base
since 31 March 2005, a 13.4% increase in total voice usage and strong data
growth, driven by successful usage stimulation programmes and innovative
services, partially offset by pressures on pricing and termination rate cuts.
Service revenue increased in the Europe region by 5.2%, or by 5.9% on an
organic basis, mainly due to growth in the customer base which was
partially offset by a decline in ARPU, with Spain and Arcor achieving
particularly strong growth. In Spain, the launch of attractive tariffs,
successful promotional campaigns and the offer of an appealing handset
portfolio increased the average customer base and encouraged growth of
44.0% in total voice usage, which contributed to a rise in service revenue of
22.0%, in local currency. In Arcor, service revenue increased by 20.7% in
local currency due to customer and usage growth, partially offset by tariff
decreases in a competitive market.
In Germany, service revenue increased by 1.4% in local currency as the
benefits of a larger customer base and increases in messaging and data
revenue were partly offset by the effect of termination rate cuts and
reduced voice pricing as a result of aggressive competition. In Italy, local
currency service revenue rose by 1.8%, reflecting the continuing growth in
non-voice services as voice revenue declined marginally following a
termination rate cut. Excluding the impact of the termination rate cut,
service revenue increased by 5.2% in local currency. In the UK, service
revenue increased by 1.6%, benefiting from an increase in the average
customer base of 7.8%, partially offset by falling ARPU and the effect of a
termination rate cut, notwithstanding a rise in voice usage. Excluding the
impact of the termination rate cut, service revenue increased by 3.2%. In
Other Europe, service revenue increased by 2.1%, or by 5.4% on an organic
basis, mainly driven by Greece where service revenue increased by 9.4% due
to a 13.6% increase in the average customer base, offset by falling ARPU
mainly due to a termination rate cut of 16.8% in September 2004, and in
Ireland, where service revenue increased by 5.9% due to a 5.9% increase in
the average customer base and a 9.2% increase in total voice usage.
Voice revenue
Voice revenue rose by 2.3%, or by 3.2% on an organic basis, with Spain as
the main contributor. Spain experienced a 20.9% increase in voice revenue
in local currency which was driven by the increase in the customer base and
the increase in total voice usage, which was encouraged by the launch of
attractive tariffs and successful promotional campaigns, partially offset by
the impact of the 10.6% cut in the termination rate in November 2005.
In Germany, voice revenue decreased by 1.3%, driven by a termination rate
cut in December 2005 from 13.2 to 11.0 eurocents per minute, and by
reduced voice pricing resulting from increasing competition, partly offset by
increased voice usage by 13.7% which was driven by new prepaid tariffs,
including a low priced internet only offer, and ongoing promotional activity
such as an offer which allowed prepaid customers to pay a fixed charge for
calls to fixed lines and other Vodafone customers which was taken up by
more than one and a quarter million customers. These offers and
promotions also assisted in increasing the average customer base by 8.4%.
In Italy, voice revenue in local currency decreased by 0.7% driven by an
average 20.5% reduction in termination rates from September 2005, partly
offset by a 5.1% increase in voice usage, which was the result of strong
promotional activities such as free calls after the first minute and the
increase in the customer base.
In the UK, the effect of the termination rate cut in September 2004 was a
decline in voice revenue of 0.8%, although this was partially offset by a rise
in total voice usage of 10.1% driven by new customer promotions such as
Stop the Clock and a rise in the average customer base of 7.8%.
In Other Europe, voice revenue remained stable as the effect of the sale of
the Group’s operations in Sweden was offset by organic growth of 3.4%.
Non-voice revenue
Messaging revenue rose by 7.2%, or 7.6% on an organic basis. The increase
was mainly driven by Italy and Spain, where strong promotional activities,
which encouraged usage growth, and the increased customer bases,
increased messaging revenue by 12.7% and 22.0% respectively.
Data revenue increased by 46.4%, or 48.8% on an organic basis, with the
primary driver being the additional 6.0 million 3G devices registered on the
Group’s networks in the Europe region since 31 March 2005, bringing the
total to 7.4 million devices at 31 March 2006.
In Germany, data revenue increased by 47.0% in local currency, with
Vodafone maintaining its leadership in the 3G market, demonstrated by
Vodafone live! with 3G customers generating over 3.1 million full track
music downloads in the 2006 financial year for Vodafone, more than any
other mobile network operator in Germany. The number of active Vodafone
live! devices continued to increase, with 28.3% growth in the 2006 financial
year. In the business segment, there were 241,000 Vodafone Mobile
Connect 3G/GPRS data cards and 226,000 wireless push e-mail enabled
devices registered on the network at 31 March 2006.
In Italy, increased penetration of 3G devices, a focus on retaining high value
customers, increased usage of Vodafone live! and Vodafone Mobile Connect
data cards and attractive data promotions were the main contributors to
29.9% growth in data revenue in local currency.
In Spain, the growth of 43.7% in data revenue in local currency was due to
an increase of 814,000 in the number of registered 3G devices and the
success of data solutions, which have contributed to Vodafone leading the
3G market in Spain, along with an 84.3% increase in the number of
Vodafone live! devices.
In the UK, growth of 843,000 over the financial year in registered 3G devices
and the continued success of Vodafone Mobile Connect data cards and
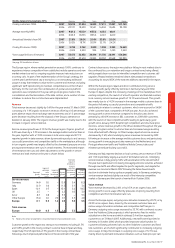
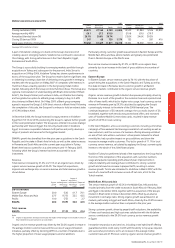
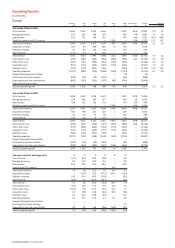
Mobile telecommunications KPIs
Germany Italy Spain UK Other Europe
Closing customers (’000) 2006 29,191 18,490 13,521 16,304 15,692 93,198
2005 27,223 17,280 11,472 15,324 15,691 86,990
Average monthly ARPU 2006 23.3 28.5 35.6 £24.0 £22.0
2005 24.9 29.9 34.5 £25.5 £23.3
Annualised blended churn (%) 2006 20.2% 18.7% 20.9% 32.1% 24.2%
2005 18.3% 17.2% 21.9% 29.7% 24.8%
Closing 3G devices (’000) 2006 2,025 2,250 902 1,033 1,230 7,440
2005 358 511 88 190 253 1,400
Voice usage (millions of minutes) 2006 26,787 29,604 23,835 28,059 27,648 135,933
2005 23,560 28,170 17,793 25,486 24,894 119,903
See page 159 for definition of terms