Vodafone 2007 Annual Report Download - page 117
Download and view the complete annual report
Please find page 117 of the 2007 Vodafone annual report below. You can navigate through the pages in the report by either clicking on the pages listed below, or by using the keyword search tool below to find specific information within the annual report.-
 1
1 -
2
-
3
-
4
-
5
-
6
-
7
-
8
-
9
-
10
-
11
-
12
-
13
-
14
-
15
-
16
-
17
-
18
-
19
-
20
-
21
-
22
-
23
-
24
-
25
-
26
-
27
-
28
-
29
-
30
-
31
-
32
-
33
-
34
-
35
-
36
-
37
-
38
-
39
-
40
-
41
-
42
-
43
-
44
-
45
-
46
-
47
-
48
-
49
-
50
-
51
-
52
-
53
-
54
-
55
-
56
-
57
-
58
-
59
-
60
-
61
-
62
-
63
-
64
-
65
-
66
-
67
-
68
-
69
-
70
-
71
-
72
-
73
-
74
-
75
-
76
-
77
-
78
-
79
-
80
-
81
-
82
-
83
-
84
-
85
-
86
-
87
-
88
-
89
-
90
-
91
-
92
-
93
-
94
-
95
-
96
-
97
-
98
-
99
-
100
-
101
-
102
-
103
-
104
-
105
-
106
-
 107
107 -
 108
108 -
 109
109 -
 110
110 -
 111
111 -
 112
112 -
 113
113 -
 114
114 -
 115
115 -
 116
116 -
 117
117 -
 118
118 -
 119
119 -
 120
120 -
 121
121 -
 122
122 -
 123
123 -
 124
124 -
 125
125 -
 126
126 -
 127
127 -
128
-
129
-
130
-
131
-
132
-
133
-
134
-
135
-
136
-
137
-
138
-
139
-
140
-
141
-
142
-
143
-
144
-
145
-
146
-
147
-
148
-
149
-
150
-
151
-
152
-
153
-
154
-
155
-
156
-
157
-
158
-
159
-
160
-
161
-
162
-
163
-
164
 |
 |
Vodafone Group Plc Annual Report 2007 115
Financials
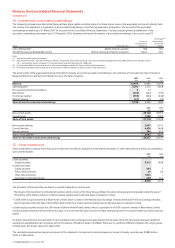
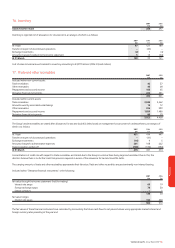
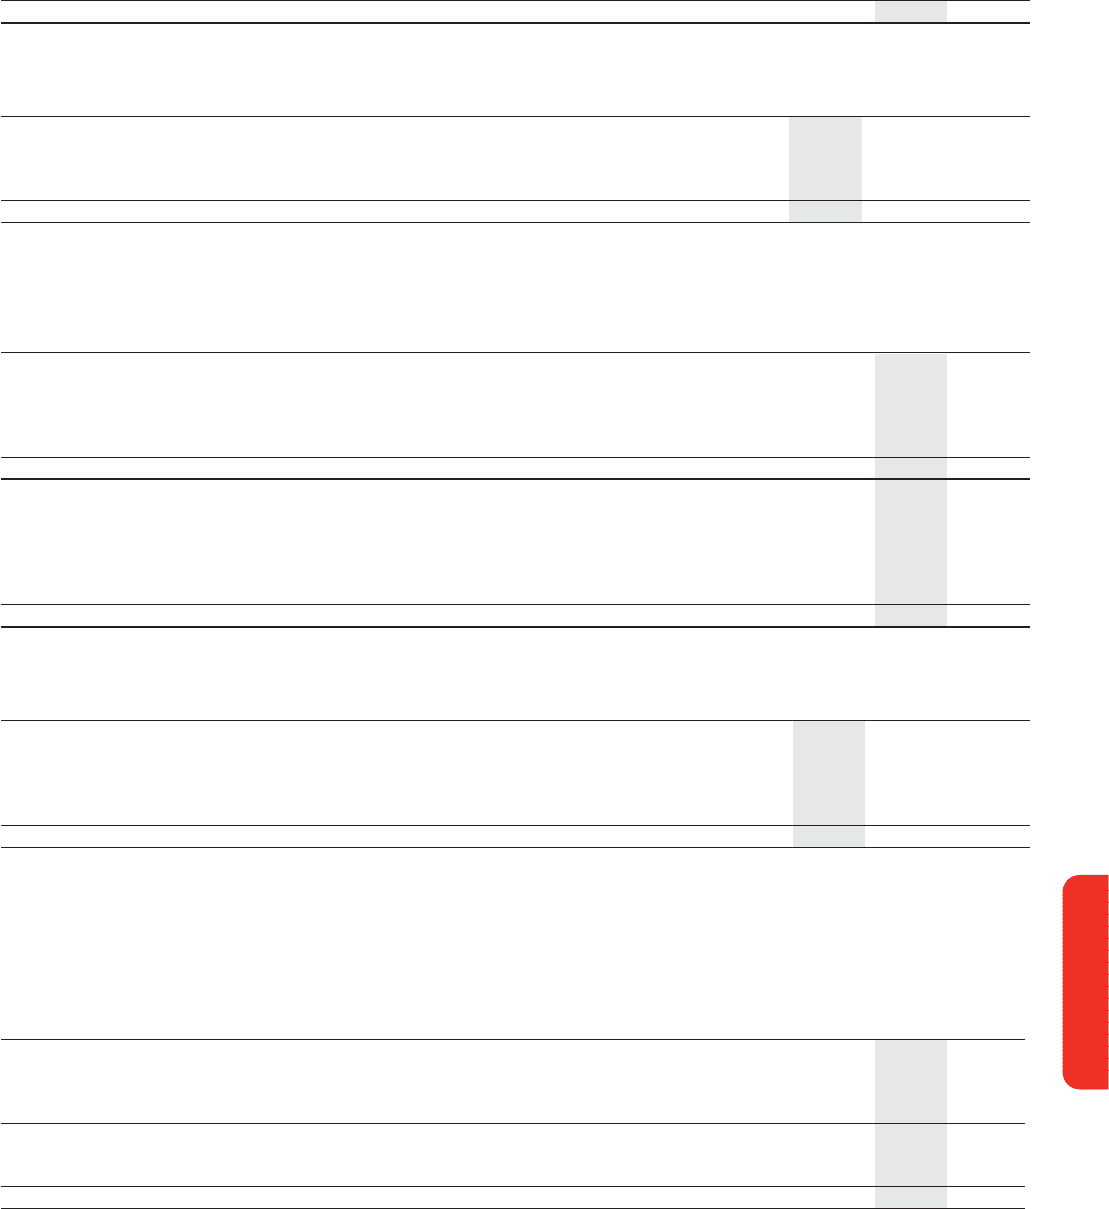
16. Inventory 2007 2006
£m £m
Goods held for resale 288 297
Inventory is reported net of allowances for obsolescence, an analysis of which is as follows:
2007 2006 2005
£m £m £m
At 1 April 97 121 189
Transfer in respect of discontinued operations –(40) –
Exchange movements (2) 1 (4)
Amounts charged/(credited) to the income statement 515 (64)
At 31 March 100 97 121
Cost of sales includes amounts related to inventory amounting to £3,797 million (2006: £3,662 million).
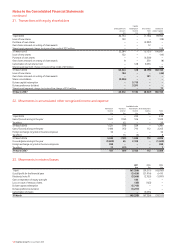
17. Trade and other receivables 2007 2006
£m £m
Included within non-current assets:
Trade receivables 42 37
Other receivables 45 28
Prepayments and accrued income 183 65
Derivative financial instruments 224 231
494 361
Included within current assets:
Trade receivables 2,844 2,462
Amounts owed by associated undertakings 14 12
Other receivables 226 399
Prepayments and accrued income 1,859 1,486
Derivative financial instruments 80 79
5,023 4,438
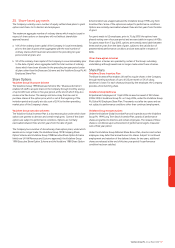
The Group’s trade receivables are stated after allowances for bad and doubtful debts based on management’s assessment of creditworthiness, an analysis of
which is as follows:
2007 2006 2005
£m £m £m
At 1 April 431 474 441
Transfer in respect of discontinued operations –(41) –
Exchange movements (16) 45
Amounts charged to administrative expenses 201 168 222
Trade receivables written off (143) (174) (194)
At 31 March 473 431 474
Concentrations of credit risk with respect to trade receivables are limited due to the Group’s customer base being large and unrelated. Due to this, the
directors believe there is no further credit risk provision required in excess of the allowance for bad and doubtful debts.
The carrying amounts of trade and other receivables approximate their fair value. Trade and other receivables are predominantly non-interest bearing.
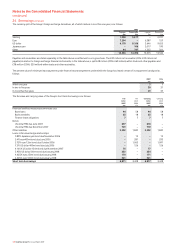
Included within “Derivative financial instruments” is the following:
2007 2006
£m £m
Fair value through the income statement: (held for trading)
Interest rate swaps 60 19
Foreign exchange swaps 78 30
Option contracts –1
138 50
Fair value hedges:
Interest rate swaps 166 260
304 310
The fair values of these financial instruments are calculated by discounting the future cash flows to net present values using appropriate market interest and
foreign currency rates prevailing at the year end.