Vodafone 2007 Annual Report Download - page 38
Download and view the complete annual report
Please find page 38 of the 2007 Vodafone annual report below. You can navigate through the pages in the report by either clicking on the pages listed below, or by using the keyword search tool below to find specific information within the annual report.-
 1
1 -
2
-
3
-
4
-
5
-
6
-
7
-
8
-
9
-
10
-
11
-
12
-
13
-
14
-
15
-
16
-
17
-
18
-
19
-
20
-
21
-
22
-
23
-
24
-
25
-
26
-
27
-
 28
28 -
 29
29 -
 30
30 -
 31
31 -
 32
32 -
 33
33 -
 34
34 -
 35
35 -
 36
36 -
 37
37 -
 38
38 -
 39
39 -
 40
40 -
 41
41 -
 42
42 -
 43
43 -
 44
44 -
 45
45 -
 46
46 -
 47
47 -
 48
48 -
49
-
50
-
51
-
52
-
53
-
54
-
55
-
56
-
57
-
58
-
59
-
60
-
61
-
62
-
63
-
64
-
65
-
66
-
67
-
68
-
69
-
70
-
71
-
72
-
73
-
74
-
75
-
76
-
77
-
78
-
79
-
80
-
81
-
82
-
83
-
84
-
85
-
86
-
87
-
88
-
89
-
90
-
91
-
92
-
93
-
94
-
95
-
96
-
97
-
98
-
99
-
100
-
101
-
102
-
103
-
104
-
105
-
106
-
107
-
108
-
109
-
110
-
111
-
112
-
113
-
114
-
115
-
116
-
117
-
118
-
119
-
120
-
121
-
122
-
123
-
124
-
125
-
126
-
127
-
128
-
129
-
130
-
131
-
132
-
133
-
134
-
135
-
136
-
137
-
138
-
139
-
140
-
141
-
142
-
143
-
144
-
145
-
146
-
147
-
148
-
149
-
150
-
151
-
152
-
153
-
154
-
155
-
156
-
157
-
158
-
159
-
160
-
161
-
162
-
163
-
164
 |
 |

36 Vodafone Group Plc Annual Report 2007
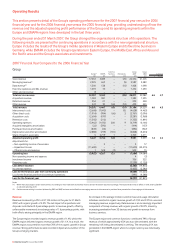
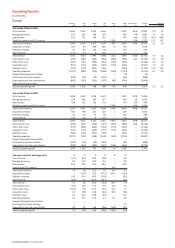
Operating Results
continued
Europe Germany Italy Spain UK Arcor Other Eliminations Europe % change
£m £m £m £m £m £m £m £m £ Organic
Year ended 31 March 2007
Voice revenue 3,995 3,329 3,435 3,621 −3,320 (343) 17,357 (2.6)
Messaging revenue 746 563 380 760 −501 (25) 2,925 3.1
Data revenue 413 189 247 295 −194 (38) 1,300 27.1
Fixed line operator and DSL revenue 1 −−−1,419 3 (26) 1,397 9.9
Other service revenue 1 2 −5−−−8
Total service revenue 5,156 4,083 4,062 4,681 1,419 4,018 (432) 22,987 0.1 2.0
Acquisition revenue 172 124 307 274 22 108 (3) 1,004 (1.4)
Retention revenue 40 36 124 52 −102 −354 (18.4)
Other revenue 75 2 7 117 −47 (1) 247 (23.8)
Total revenue 5,443 4,245 4,500 5,124 1,441 4,275 (436) 24,592 (0.6) 1.4
Interconnect costs (645) (628) (675) (1,001) (338) (813) 432 (3,668) (1.9)
Other direct costs (332) (242) (352) (452) (262) (275) 1 (1,914) 14.9
Acquisition costs (560) (249) (642) (677) (178) (301) 3 (2,604) 4.1
Retention costs (351) (107) (398) (372) −(315) −(1,543) (11.9)
Operating expenses (1,126) (870) (866) (1,163) (396) (1,041) −(5,462) 4.2
Acquired intangibles amortisation −−−(11) −(11) −(22)
Purchased licence amortisation (340) (75) (37) (333) −(64) −(849)
Depreciation and other amortisation (735) (499) (430) (604) (96) (524) −(2,888)
Share of result in associates −−−−− 5−5
Adjusted operating profit 1,354 1,575 1,100 511 171 936 – 5,647 (5.1) (4.7)
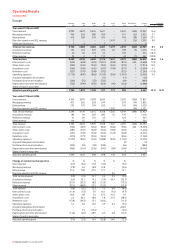
Year ended 31 March 2006
Voice revenue 4,304 3,472 3,093 3,642 −3,672 (356) 17,827
Messaging revenue 815 526 328 674 −507 (14) 2,836
Data revenue 275 172 194 252 −170 (40) 1,023
Fixed line operator and DSL revenue −−−−1,305 −(34) 1,271
Total service revenue 5,394 4,170 3,615 4,568 1,305 4,349 (444) 22,957
Acquisition revenue 185 94 269 285 15 170 −1,018
Retention revenue 61 84 105 60 −124 −434
Other revenue 114 15 6 135 −54 −324
Total revenue 5,754 4,363 3,995 5,048 1,320 4,697 (444) 24,733
Interconnect costs (732) (681) (634) (862) (368) (906) 444 (3,739)
Other direct costs (281) (241) (329) (355) (187) (273) −(1,666)
Acquisition costs (551) (172) (543) (665) (147) (423) −(2,501)
Retention costs (410) (177) (354) (455) −(356) −(1,752)
Operating expenses (1,077) (822) (762) (1,088) (390) (1,104) −(5,243)
Acquired intangibles amortisation −−−−−(2) −(2)
Purchased licence amortisation (342) (74) (69) (333) −(66) −(884)
Depreciation and other amortisation (865) (524) (336) (592) (89) (594) −(3,000)
Share of result in associates −−−−− 5−5
Adjusted operating profit 1,496 1,672 968 698 139 978 −5,951
Change at constant exchange rates %%%%% %
Voice revenue (6.7) (3.6) 11.8 (0.6) −(9.2)
Messaging revenue (7.8) 7.6 16.8 12.8 −(0.6)
Data revenue 51.2 10.8 27.5 17.1 −15.1
Fixed line operator and DSL revenue −−−−9.5 −
Total service revenue (3.9) (1.5) 13.1 2.5 9.5 (7.2)
Acquisition revenue (6.4) 33.1 14.5 (3.9) 45.7 (35.7)
Retention revenue (34.1) (57.2) 18.8 (13.3) −(17.2)
Other revenue (33.5) (89.8) 22.5 (13.3) −(15.7)
Total revenue (4.8) (2.2) 13.3 1.5 9.8 (8.6)
Interconnect costs (11.4) (7.2) 7.0 16.1 (7.6) (9.7)
Other direct costs 18.9 0.8 7.6 27.3 41.6 1.0
Acquisition costs 2.2 46.1 18.8 1.8 21.3 (28.6)
Retention costs (13.8) (39.3) 13.1 (18.2) −(11.2)
Operating expenses 5.1 6.6 14.2 6.9 2.3 (5.5)
Acquired intangibles amortisation −−−−−423.8
Purchased licence amortisation −1.5 (45.4) −−(3.5)
Depreciation and other amortisation (14.4) (4.5) 28.9 2.0 6.8 (11.2)
Share of result in associates −−−−− −
Adjusted operating profit (9.0) (5.3) 14.4 (26.8) 24.0 (3.7)