Vodafone 2007 Annual Report Download - page 65
Download and view the complete annual report
Please find page 65 of the 2007 Vodafone annual report below. You can navigate through the pages in the report by either clicking on the pages listed below, or by using the keyword search tool below to find specific information within the annual report.-
 1
1 -
2
-
3
-
4
-
5
-
6
-
7
-
8
-
9
-
10
-
11
-
12
-
13
-
14
-
15
-
16
-
17
-
18
-
19
-
20
-
21
-
22
-
23
-
24
-
25
-
26
-
27
-
28
-
29
-
30
-
31
-
32
-
33
-
34
-
35
-
36
-
37
-
38
-
39
-
40
-
41
-
42
-
43
-
44
-
45
-
46
-
47
-
48
-
49
-
50
-
51
-
52
-
53
-
54
-
 55
55 -
 56
56 -
 57
57 -
 58
58 -
 59
59 -
 60
60 -
 61
61 -
 62
62 -
 63
63 -
 64
64 -
 65
65 -
 66
66 -
 67
67 -
 68
68 -
 69
69 -
 70
70 -
 71
71 -
 72
72 -
 73
73 -
 74
74 -
 75
75 -
76
-
77
-
78
-
79
-
80
-
81
-
82
-
83
-
84
-
85
-
86
-
87
-
88
-
89
-
90
-
91
-
92
-
93
-
94
-
95
-
96
-
97
-
98
-
99
-
100
-
101
-
102
-
103
-
104
-
105
-
106
-
107
-
108
-
109
-
110
-
111
-
112
-
113
-
114
-
115
-
116
-
117
-
118
-
119
-
120
-
121
-
122
-
123
-
124
-
125
-
126
-
127
-
128
-
129
-
130
-
131
-
132
-
133
-
134
-
135
-
136
-
137
-
138
-
139
-
140
-
141
-
142
-
143
-
144
-
145
-
146
-
147
-
148
-
149
-
150
-
151
-
152
-
153
-
154
-
155
-
156
-
157
-
158
-
159
-
160
-
161
-
162
-
163
-
164
 |
 |

Vodafone Group Plc Annual Report 2007 63
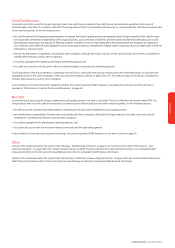
Cash Flow Measures
In presenting and discussing the Group's reported results, free cash flow and operating free cash flow are calculated and presented on the basis of
methodologies other than in accordance with IFRS. The Group believes that it is both useful and necessary to communicate free cash flow to investors and
other interested parties, for the following reasons:
•free cash flow allows the Company and external parties to evaluate the Group's liquidity and the cash generated by the Group's operations. Free cash flow does
not include items determined independently of the ongoing business, such as the level of dividends, and items which are deemed discretionary, such as cash
flows relating to acquisitions and disposals or financing activities. In addition, it does not necessarily reflect the amounts which the Group has an obligation to
incur. However, it does reflect the cash available for such discretionary activities, to strengthen the balance sheet or to provide returns to shareholders in the form
of dividends or share purchases;
•free cash flow facilitates comparability of results with other companies, although the Group's measure of free cash flow may not be directly comparable to
similarly titled measures used by other companies;
•it is used by management for planning, reporting and incentive purposes; and
•it is useful in connection with discussion with the investment analyst community and debt rating agencies.
The Group believes that the presentation of operating free cash flow is useful and necessary for investors and other interested parties as it provides the
quantitative basis for the cash flow targets of the cost reduction initiatives outlined on pages 38 to 39. This measure may not be directly comparable to
similarly titled measures used by other companies.
A reconciliation of net cash inflow from operating activities, the closest equivalent GAAP measure, to operating free cash flow and free cash flow, is
provided in “Performance - Financial Position and Resources” on page 52.
Net Debt
In presenting and discussing the Group's indebtedness and liquidity position, net debt is calculated. There is no definition of net debt within IFRS. The
Group believes that it is both useful and necessary to communicate net debt to investors and other interested parties, for the following reasons:
•net debt assists the Company and external parties in evaluating the Group's overall indebtedness and liquidity position;
•net debt facilitates comparability of indebtedness and liquidity with other companies, although the Group's measure of net debt may not be directly
comparable to similarly titled measures used by other companies;
•it is used by management for planning and reporting purposes; and
•it is used in discussions with the investment analyst community and the debt rating agencies.
A reconciliation of short term and long term borrowings, the closest equivalent GAAP measures, to net debt is shown on page 55.
Other
Certain of the statements within the section titled “Strategy - Chief Executive's Review” on pages 6 to 7 and the section titled “Performance - Cost
reduction initiatives”, on pages 38 to 39, contain forward-looking non-GAAP financial information for which at this time there is no comparable GAAP
measure and which at this time cannot be quantitatively reconciled to comparable GAAP financial information.
Certain of the statements within the section titled “Performance - Risk Factors, Seasonality and Outlook” on pages 58 to 60, contain forward-looking non-
GAAP financial information which at this time cannot be quantitatively reconciled to comparable GAAP financial information.
PerformancePerformance