Vodafone 2007 Annual Report Download - page 112
Download and view the complete annual report
Please find page 112 of the 2007 Vodafone annual report below. You can navigate through the pages in the report by either clicking on the pages listed below, or by using the keyword search tool below to find specific information within the annual report.-
 1
1 -
2
-
3
-
4
-
5
-
6
-
7
-
8
-
9
-
10
-
11
-
12
-
13
-
14
-
15
-
16
-
17
-
18
-
19
-
20
-
21
-
22
-
23
-
24
-
25
-
26
-
27
-
28
-
29
-
30
-
31
-
32
-
33
-
34
-
35
-
36
-
37
-
38
-
39
-
40
-
41
-
42
-
43
-
44
-
45
-
46
-
47
-
48
-
49
-
50
-
51
-
52
-
53
-
54
-
55
-
56
-
57
-
58
-
59
-
60
-
61
-
62
-
63
-
64
-
65
-
66
-
67
-
68
-
69
-
70
-
71
-
72
-
73
-
74
-
75
-
76
-
77
-
78
-
79
-
80
-
81
-
82
-
83
-
84
-
85
-
86
-
87
-
88
-
89
-
90
-
91
-
92
-
93
-
94
-
95
-
96
-
97
-
98
-
99
-
100
-
101
-
 102
102 -
 103
103 -
 104
104 -
 105
105 -
 106
106 -
 107
107 -
 108
108 -
 109
109 -
 110
110 -
 111
111 -
 112
112 -
 113
113 -
 114
114 -
 115
115 -
 116
116 -
 117
117 -
 118
118 -
 119
119 -
 120
120 -
 121
121 -
 122
122 -
123
-
124
-
125
-
126
-
127
-
128
-
129
-
130
-
131
-
132
-
133
-
134
-
135
-
136
-
137
-
138
-
139
-
140
-
141
-
142
-
143
-
144
-
145
-
146
-
147
-
148
-
149
-
150
-
151
-
152
-
153
-
154
-
155
-
156
-
157
-
158
-
159
-
160
-
161
-
162
-
163
-
164
 |
 |

110 Vodafone Group Plc Annual Report 2007
Notes to the Consolidated Financial Statements
continued
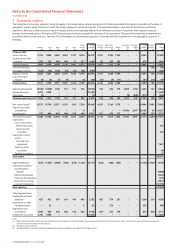
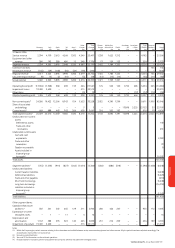
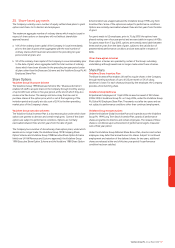
10. Impairment continued
In the year ended 31 March 2005, the impairment was based on value in use calculations. The pre-tax risk adjusted discount rate used in the testing at
31 March 2005 was 9.7%.
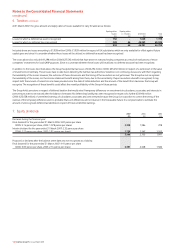
Cash generating units
The following cash-generating units, being the lowest level of asset for which there are separately identifiable cash flows, have carrying amounts of goodwill
that are considered significant in comparison with the Group’s total goodwill balance:
2007 2006
£m £m
Germany 9,355 16,518
Italy 11,125 16,475
Spain 10,285 10,571
30,765 43,564
Multiple units without individually significant amounts of goodwill 9,802 9,042
40,567 52,606
Key assumptions used in the value in use calculations
The Group prepares and internally approves formal ten year management plans for its businesses. For the year ended 31 March 2005, the Group used these
plans for its value in use calculations. The plans included cash flow projections for the mobile businesses which were expected to have growth rates in excess
of the long term average growth rates, beyond an initial five year period, for the markets in which they operate.
In the year ended 31 March 2006, the management plans showed the need to reflect a differing growth profile beyond an initial five year period had
diminished in a number of the Group’s key operating companies, as the Group revised its view of longer term trends. Accordingly, in the 2006 and 2007
financial years, only the first five years of the ten year management plans were used for the Group’s value in use calculations, except for the Group’s
operations in India and Turkey (2006: India) where the full ten year management plans were used. For these businesses, the use of ten year management
plans reflected the low penetration of mobile telecommunications in these countries and the expectation of strong revenue growth throughout the ten year
period. Long term growth rates are used in the Group’s value in use calculations for cash flows into perpetuity beyond the relevant five or ten year periods.
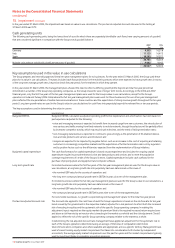
The key assumptions used in determining the value in use are:
Assumption How determined
Budgeted EBITDA Budgeted EBITDA, calculated as adjusted operating profit before depreciation and amortisation, has been based on
past experience adjusted for the following:
•voice and messaging revenue is expected to benefit from increased usage from new customers, the introduction of
new services and traffic moving from fixed networks to mobile networks, though these factors will be partially offset
by increased competitor activity, which may result in price declines, and the trend of falling termination rates;
•non-messaging data revenue is expected to continue to grow strongly as the penetration of 3G enabled devices
rises and new products and services are introduced; and
•margins are expected to be impacted by negative factors such as an increase in the cost of acquiring and retaining
customers in increasingly competitive markets and the expectation of further termination rate cuts by regulators
and by positive factors such as the efficiencies expected from the implementation of Group initiatives.
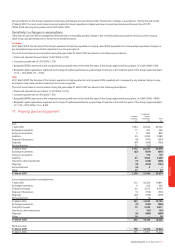
Budgeted capital expenditure The cash flow forecasts for capital expenditure is based on past experience and includes the ongoing capital
expenditure required to provide enhanced voice and data products and services and to meet the population
coverage requirements of certain of the Group’s licences. Capital expenditure includes cash outflows for the
purchase of property, plant and equipment and computer software.
Long term growth rate For mobile businesses where the first five years of the ten year management plan are used for the Group’s value in
use calculations, a long term growth rate into perpetuity has been determined as the lower of:
•the nominal GDP rates for the country of operation; and
•the long term compound annual growth rate in EBITDA in years six to ten of the management plan.
For mobile businesses where the full ten year management plans are used for the Group’s value in use calculations, a
long term growth rate into perpetuity has been determined as the lower of:
•the nominal GDP rates for the country of operation; and
•the compound annual growth rate in EBITDA in years nine to ten of the management plan.
For non-mobile businesses, no growth is expected beyond management’s plans for the initial five year period.
Pre-tax risk adjusted discount rate The discount rate applied to the cash flows of each the Group’s operations is based on the risk free rate for ten year
bonds issued by the government in the respective market, adjusted for a risk premium to reflect both the increased
risk of investing in equities and the systematic risk of the specific Group operating company. In making this
adjustment, inputs required are the equity market risk premium (that is the required increased return required over
and above a risk free rate by an investor who is investing in the market as a whole) and the risk adjustment (“beta”)
applied to reflect the risk of the specific Group operating company relative to the market as a whole.
In determining the risk adjusted discount rate, management have applied an adjustment for the systematic risk to
each of the Group’s operations determined using an average of the betas of comparable listed mobile
telecommunications companies and, where available and appropriate, across a specific territory. Management have
used a forward looking equity market risk premium that takes into consideration both studies by independent
economists, the average equity market risk premium over the past ten years and the market risk premiums typically
used by investment banks in evaluating acquisition proposals.