Vodafone 2007 Annual Report Download - page 10
Download and view the complete annual report
Please find page 10 of the 2007 Vodafone annual report below. You can navigate through the pages in the report by either clicking on the pages listed below, or by using the keyword search tool below to find specific information within the annual report.-
 1
1 -
 2
2 -
 3
3 -
 4
4 -
 5
5 -
 6
6 -
 7
7 -
 8
8 -
 9
9 -
 10
10 -
 11
11 -
 12
12 -
 13
13 -
 14
14 -
 15
15 -
 16
16 -
 17
17 -
 18
18 -
 19
19 -
 20
20 -
 21
21 -
22
-
23
-
24
-
25
-
26
-
27
-
28
-
29
-
30
-
31
-
32
-
33
-
34
-
35
-
36
-
37
-
38
-
39
-
40
-
41
-
42
-
43
-
44
-
45
-
46
-
47
-
48
-
49
-
50
-
51
-
52
-
53
-
54
-
55
-
56
-
57
-
58
-
59
-
60
-
61
-
62
-
63
-
64
-
65
-
66
-
67
-
68
-
69
-
70
-
71
-
72
-
73
-
74
-
75
-
76
-
77
-
78
-
79
-
80
-
81
-
82
-
83
-
84
-
85
-
86
-
87
-
88
-
89
-
90
-
91
-
92
-
93
-
94
-
95
-
96
-
97
-
98
-
99
-
100
-
101
-
102
-
103
-
104
-
105
-
106
-
107
-
108
-
109
-
110
-
111
-
112
-
113
-
114
-
115
-
116
-
117
-
118
-
119
-
120
-
121
-
122
-
123
-
124
-
125
-
126
-
127
-
128
-
129
-
130
-
131
-
132
-
133
-
134
-
135
-
136
-
137
-
138
-
139
-
140
-
141
-
142
-
143
-
144
-
145
-
146
-
147
-
148
-
149
-
150
-
151
-
152
-
153
-
154
-
155
-
156
-
157
-
158
-
159
-
160
-
161
-
162
-
163
-
164
 |
 |

8Vodafone Group Plc Annual Report 2007
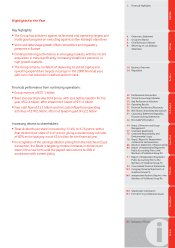
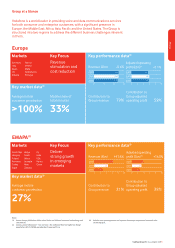
Delivering on Our Strategic Objectives
The Group’s strategy is to drive
additional usage and revenue from
core mobile voice and messaging
services, which represents around
80% of revenue in Europe today, and
to reduce its cost base.
Today, around one third of voice traffic
is carried over mobile networks, with
Vodafone’s customers only using their
mobiles for approximately 140
minutes on average per month. This
provides a significant opportunity to
drive greater voice usage onto mobile.
The Group has launched a number of
initiatives to achieve this through
larger minute bundles, innovative
tariffs, prepaid to contract migrations
and targeted promotions, with a key
focus also on leveraging Vodafone’s
market leading presence across Europe
in the business segment, which
represents around 25% of service
revenue. Vodafone’s unique presence
also allows it to offer Pan-European
products and services such as Vodafone
Passport for roaming customers.
Whilst usage growth in the year was
strong, pricing pressure continues to
be high and the Group’s key focus is
to improve the overall price
elasticity of its offerings in the
market place.
The Group has established several core
cost reduction programmes,
leveraging the benefits of its local and
regional scale. Key initiatives have
focused on the outsourcing and
centralisation of certain activities, as
well as network sharing arrangements
with other operators.
Summer promotions driving
usage in Italy
Over 3 million customers benefited
from successful summer promotions
in Italy which stimulated voice and
messaging usage and revenue. For a
monthly fee and per call set up
charge, customers were able to make
calls and send messages for free to
other Vodafone customers. Customers
in the voice promotion generated 22%
more ARPU than before and 9% more
in the messaging promotion.
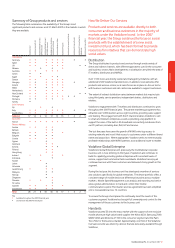
The communications environment is
constantly evolving and Vodafone is
at the forefront of this change.
Customers are increasingly looking
for one supplier to address all their
needs, whether that is for mobile or
fixed services.
The Group is increasingly targeting
its propositions on replacing
traditional fixed line providers in the
home or office, as well as developing
new and innovative ways
for customers to enjoy the benefits
of mobility.
Vodafone is already delivering
broadband and data services to
customers and, together with
industry leading partners, will
shortly be driving new revenue
streams from opening up the
internet to the mobile and from
mobile advertising.
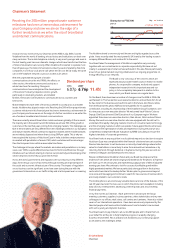
In total, the Group expects its total
communications initiatives to
represent approximately 20% of
Group revenue in three years’ time,
increasing from approximately 10%
for the 2007 financial year.
Total communications initiatives
(share of Group revenue, %)
The Group’s focus is to build on its
strong track record of creating value
in emerging markets where average
market penetration is relatively low,
offering significant customer and
revenue growth potential.
In the last 12 months, Vodafone has
gained control of businesses in
Turkey, with a population of 70 million,
and in India, with a population of
1.1 billion, adding to the Group’s
existing emerging market presence in
parts of the Middle East, Africa and
Eastern Europe.
During the 2007 financial year, the
Group saw strong performances in
Egypt, Romania and South Africa,
with Turkey performing ahead of the
business plan at the time of the
acquisition.
As a result of the Group’s increased
presence in emerging markets, the
proportion of Group EBITDA from
the EMAPA region is expected to
increase from 19% this year to
around 33% in five years’ time.
Vodafone will continue to seek
selective opportunities to increase
its emerging markets footprint as
well as taking opportunities to
increase its stakes in existing
markets, with a view to gaining
control over time.
Romania: Market leader
for business services
Vodafone extended its leadership in
the business segment in Romania
during the year, with 38% growth in
business customers giving a market
share of 42%. Key to success has
been its integrated mobile and fixed
communications solution which
delivered over 50% revenue growth
in the year and now represents one
third of business revenues.
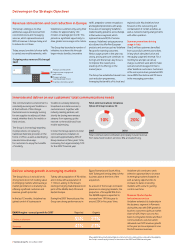
Revenue stimulation and cost reduction in Europe
Innovate and deliver on our customers’ total communications needs
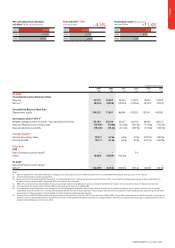
Deliver strong growth in emerging markets
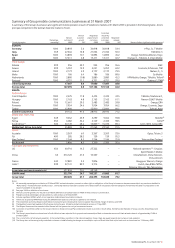
EMAPA region – annual growth for 2007 Reported Organic
Closing customers 55% 27%
Revenue 41% 21%
Where applicable, growth percentages are stated on local currency and are calculated by applying
the Group’s current equity interest to the whole of the 2007 and 2006 financial years.
10% 20%
2007 2010
Total communications initiatives principally include revenue
from data, fixed location services, DSL and advertising.
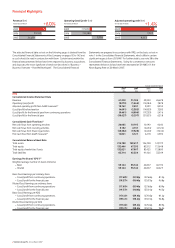
Outgoing voice revenue (% change)
2007
+8
+14
-17
+2
Average customer growth
Outgoing voice usage growth
per customer
Change in effective
outgoing price per minute
Outgoing voice revenue growth