Vodafone 2007 Annual Report Download - page 44
Download and view the complete annual report
Please find page 44 of the 2007 Vodafone annual report below. You can navigate through the pages in the report by either clicking on the pages listed below, or by using the keyword search tool below to find specific information within the annual report.-
 1
1 -
2
-
3
-
4
-
5
-
6
-
7
-
8
-
9
-
10
-
11
-
12
-
13
-
14
-
15
-
16
-
17
-
18
-
19
-
20
-
21
-
22
-
23
-
24
-
25
-
26
-
27
-
28
-
29
-
30
-
31
-
32
-
33
-
 34
34 -
 35
35 -
 36
36 -
 37
37 -
 38
38 -
 39
39 -
 40
40 -
 41
41 -
 42
42 -
 43
43 -
 44
44 -
 45
45 -
 46
46 -
 47
47 -
 48
48 -
 49
49 -
 50
50 -
 51
51 -
 52
52 -
 53
53 -
 54
54 -
55
-
56
-
57
-
58
-
59
-
60
-
61
-
62
-
63
-
64
-
65
-
66
-
67
-
68
-
69
-
70
-
71
-
72
-
73
-
74
-
75
-
76
-
77
-
78
-
79
-
80
-
81
-
82
-
83
-
84
-
85
-
86
-
87
-
88
-
89
-
90
-
91
-
92
-
93
-
94
-
95
-
96
-
97
-
98
-
99
-
100
-
101
-
102
-
103
-
104
-
105
-
106
-
107
-
108
-
109
-
110
-
111
-
112
-
113
-
114
-
115
-
116
-
117
-
118
-
119
-
120
-
121
-
122
-
123
-
124
-
125
-
126
-
127
-
128
-
129
-
130
-
131
-
132
-
133
-
134
-
135
-
136
-
137
-
138
-
139
-
140
-
141
-
142
-
143
-
144
-
145
-
146
-
147
-
148
-
149
-
150
-
151
-
152
-
153
-
154
-
155
-
156
-
157
-
158
-
159
-
160
-
161
-
162
-
163
-
164
 |
 |

42 Vodafone Group Plc Annual Report 2007
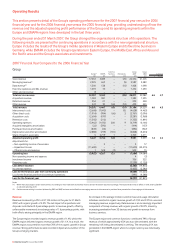
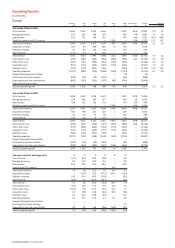
Operating Results
continued
South Africa, whilst the continued rollout of the 3G network led to strong
growth in data revenue.
Bharti Airtel continued to perform well with strong growth in customers and
revenue, demonstrating the growth potential in the Indian market.
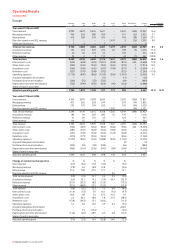
Pacific
Service revenue increased by 2.7%, with the impact of adverse foreign
exchange movements reducing reported growth by 7.3 percentage points.
In Australia, a continued focus on higher value customers delivered local
currency service revenue growth of 13.7%, with improvements in both
prepaid and contract ARPU. The performance in Australia more than offset
the reduced growth in local currency service revenue in New Zealand,
where local currency service revenue growth was 2.6% following a cut in
termination rates, which reduced reported service revenue growth by 4.1%.
After the negative impact of foreign exchange movements, reported service
revenue in New Zealand declined by 7.9%.
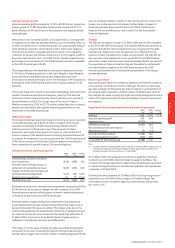
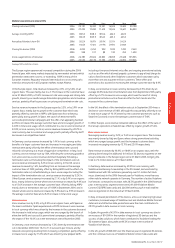
Adjusted operating profit
The impact of acquisitions, disposal and exchange rates on adjusted operating
profit is shown below.
Impact of Impact of
exchange acquisitions
Organic rates and disposal(1) Reported
growth Percentage Percentage growth
% points points %
Adjusted operating profit
Eastern Europe 49.2 (7.6) (37.1) 4.5
Middle East, Africa and Asia 18.5 (16.9) 31.1 32.7
Pacific 25.4 (11.8) – 13.6
EMAPA 24.3 (7.2) (1.1) 16.0
Note:
(1) Impact of acquisitions and disposal includes the impact of the change in consolidation status
of Bharti Airtel from a joint venture to an investment
Adjusted operating profit increased by 16.0%. On an organic basis, growth
was 24.3%, as the acquisitions and stake increases led to the rise in acquired
intangible asset amortisation reducing reported growth in operating profit.
These acquisitions, combined with the continued expansion of network
infrastructure in the region, including 3G and HSDPA upgrades, resulted in
higher depreciation charges. Organic growth in adjusted operating profit
was driven by a strong performance in Romania, Egypt, South Africa and the
Group’s associated undertaking in the US.
Eastern Europe
Interconnect costs increased by 46.3%, or 23.8% on an organic basis,
principally as a result of the higher usage in Romania. An ongoing
regulatory fee in Turkey amounting to 15% of revenue has increased other
direct costs compared to the 2006 financial year.
Acquisition costs fell as a percentage of service revenue throughout most of
Eastern Europe, with increased investment in the direct distribution channel
in Romania resulting in lower subsidies on handsets. Retention costs
decreased as a percentage of service revenue, but increased on an organic
basis due to a focus on retaining customers through loyalty programmes in
response to the increasing competition in Romania, which had a positive
impact on contract and prepaid churn.
Operating expenses increased by 1.0 percentage point as a percentage of
service revenue, primarily as a result of inflationary pressures in Romania
and investment in Turkey.
Middle East, Africa and Asia
Interconnect costs increased by 45.0%, or 26.8% on an organic basis, due to
the usage stimulation initiatives throughout the region.
Acquisition costs remained stable as a percentage of service revenue, whilst
retention costs increased, principally due to increased investment in
retaining customers in Egypt ahead of the forthcoming launch of services
by a new operator and in South Africa in response to the introduction of
mobile number portability during the year, with the provision of 3G and data
enabled device upgrades for contract customers and a loyalty point
scheme. Operating expenses remained stable as a percentage of service
revenue.
Pacific
The improved profitability in Australia was more than offset by the lower
profitability in New Zealand resulting from the increased cost of
telecommunications service obligation regulation, the impact of the
acquisition of ihug and adverse foreign exchange rates.
Acquisition and retention costs increased as a percentage of service
revenue due to the investment in higher value customers in Australia, which
also had a favourable impact on contract churn and were partially offset by
savings in network costs and operating expenses.
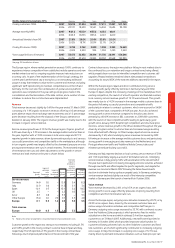
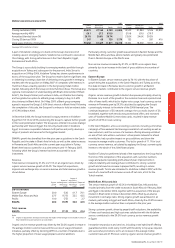
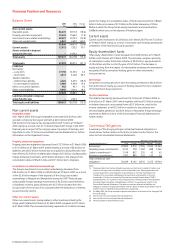
Associates
2007 % change
Verizon Verizon
Wireless Other Total Wireless
Share of result of associates £m £m £m £$
Operating profit 2,442 940 3,382 15.6 22.9
Interest (179) (27) (206) (12.3) (7.0)
Tax (125) (271) (396) 7.8 14.6
Minority interest (61) – (61) 1.7 6.7
2,077 642 2,719 19.9 27.6
2006
Verizon
Wireless Other Total
Share of result of associates £m £m £m
Operating profit 2,112 1,010 3,122
Interest (204) (23) (227)
Tax (116) (329) (445)
Minority interest (60) 8 (52)
1,732 666 2,398
% change
Verizon
Wireless
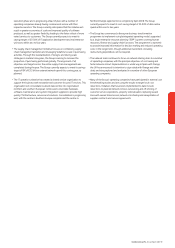
Verizon Wireless (100% basis) 2007 2006 £ $
Total revenue (£m) 20,860 18,875 10.5 17.4
Closing customers (’000) 60,716 53,020
Average monthly ARPU ($) 52.5 51.4
Blended churn (%) 13.9% 14.7%
Mobile non-voice service revenue
as a percentage of mobile service
revenue (%) 14.4% 8.9%
Verizon Wireless produced another year of record growth in organic net
additions, increasing its customer base by 7.7 million in the year ended
31 March 2007. The performance was particularly robust in the higher value
contract segment and was achieved in a market where the estimated
closing mobile penetration reached 80%.
The strong customer growth was achieved through a combination of higher
gross additions and improvements in Verizon Wireless’s customer loyalty,
with the latter evidenced through lower levels of churn. The 15.4% growth
in the average mobile customer base combined with a 2.1% increase in
ARPU resulted in a 17.8% increase in service revenue. ARPU growth was
achieved through the continued success of data services, driven
predominantly by data cards, wireless e-mail and messaging services.
Verizon Wireless’s operating profit also improved due to efficiencies in other
direct costs and operating expenses, partly offset by a higher level of
customer acquisition and retention activity.
Verizon Wireless continued to lay the foundations for future data revenue
growth through the launch of both CDMA EV-DO Rev A, an enhanced
wireless broadband service, and broadcast mobile TV services during the
first calendar quarter of 2007. In addition, Verizon Wireless consolidated its
spectrum position during the year with the acquisition of spectrum through
the FCC’s Advanced Wireless Services auction for $2.8 billion.