Vodafone 2007 Annual Report Download - page 62
Download and view the complete annual report
Please find page 62 of the 2007 Vodafone annual report below. You can navigate through the pages in the report by either clicking on the pages listed below, or by using the keyword search tool below to find specific information within the annual report.-
 1
1 -
2
-
3
-
4
-
5
-
6
-
7
-
8
-
9
-
10
-
11
-
12
-
13
-
14
-
15
-
16
-
17
-
18
-
19
-
20
-
21
-
22
-
23
-
24
-
25
-
26
-
27
-
28
-
29
-
30
-
31
-
32
-
33
-
34
-
35
-
36
-
37
-
38
-
39
-
40
-
41
-
42
-
43
-
44
-
45
-
46
-
47
-
48
-
49
-
50
-
51
-
 52
52 -
 53
53 -
 54
54 -
 55
55 -
 56
56 -
 57
57 -
 58
58 -
 59
59 -
 60
60 -
 61
61 -
 62
62 -
 63
63 -
 64
64 -
 65
65 -
 66
66 -
 67
67 -
 68
68 -
 69
69 -
 70
70 -
 71
71 -
 72
72 -
73
-
74
-
75
-
76
-
77
-
78
-
79
-
80
-
81
-
82
-
83
-
84
-
85
-
86
-
87
-
88
-
89
-
90
-
91
-
92
-
93
-
94
-
95
-
96
-
97
-
98
-
99
-
100
-
101
-
102
-
103
-
104
-
105
-
106
-
107
-
108
-
109
-
110
-
111
-
112
-
113
-
114
-
115
-
116
-
117
-
118
-
119
-
120
-
121
-
122
-
123
-
124
-
125
-
126
-
127
-
128
-
129
-
130
-
131
-
132
-
133
-
134
-
135
-
136
-
137
-
138
-
139
-
140
-
141
-
142
-
143
-
144
-
145
-
146
-
147
-
148
-
149
-
150
-
151
-
152
-
153
-
154
-
155
-
156
-
157
-
158
-
159
-
160
-
161
-
162
-
163
-
164
 |
 |

60 Vodafone Group Plc Annual Report 2007
Risk Factors, Seasonality and Outlook
continued
The Group expects capitalised fixed asset additions to be in the range of
£4.7 billion to £5.1 billion, including in excess of £1.0 billion in India.
Reported free cash flow is expected to be in the range of £4.0 billion to
£4.5 billion. This is after taking into account £0.6 billion of expected tax
payments and associated interest in respect of the potential settlement of a
number of long standing tax issues, a net cash outflow of approximately
£0.8 billion anticipated in respect of India and £0.5 billion from deferred
payments and the reversal of certain timing differences that benefited the
2007 financial year. The outlook for free cash flow is stated including the
impact of known spectrum or licence payments only.
The Group still expects that significant cash tax and associated interest
payments may be made in the next two years in respect of long standing tax
issues, although the timing of such payments remains uncertain. Within this
timeframe, the Group continues to anticipate possible resolution to the
application of the UK Controlled Foreign Company legislation to the Group.
The adjusted effective tax rate percentage is expected to be in the low 30s,
slightly higher than the 2007 financial year and consistent with the Group’s
longer term expectations.
Revenue stimulation and cost reduction in Europe
The Group continues to target delivering benefits equivalent to at least 1%
additional revenue market share in the year compared with the 2005
financial year. Capitalised mobile fixed asset additions are expected to be
10% of mobile revenue for the year for the total of the Europe region and
common functions.
The Group also expects mobile operating expenses to be broadly stable for
the total of the Europe region and common functions when compared with
the 2006 financial year on an organic basis, excluding the potential impact
from developing and delivering new services and from any business
restructuring costs.
Proportionate measures
Proportionate presentation is not a measure recognised under IFRS and is
not intended to replace the full year results prepared in accordance with
IFRS. However, since significant entities in which the Group has an interest
are not consolidated, proportionate information is provided as
supplemental data to facilitate a more detailed understanding and
assessment of the full year results prepared in accordance with IFRS.
IFRS requires consolidation of entities which the Group has the power to
control and allows either proportionate consolidation or equity accounting
for joint ventures. IFRS also requires equity accounting for interests in which
the Group has significant influence but not a controlling interest.
The proportionate presentation, below, is a pro rata consolidation, which
reflects the Group’s share of revenue and expenses in entities, both
consolidated and unconsolidated, in which the Group has an ownership
interest. Proportionate results are calculated by multiplying the Group’s
ownership interest in each entity by each entity’s results.
Proportionate presentation of financial information differs in material
respects to the proportionate consolidation adopted by the Group under
IFRS for its joint ventures.
Proportionate information includes results from the Group’s equity
accounted investments and other investments. The Group may not have
control over the revenue, expenses or cash flows of these investments and
may only be entitled to cash from dividends received from these entities.
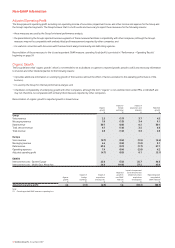
Reconciliations of proportionate mobile revenue and EBITDA margin, and
their respective reported growth rates in the 2007 financial year, to the
closest equivalent GAAP measures are as follows:
Reported
2007 2006 growth
£m £m %
Proportionate revenue 43,613 41,355
Mobile telecommunications 42,273 40,217 5.1
Other operations and intercompany 1,340 1,138
Minority share in subsidiary undertakings 829 666
Group share in associated undertakings
and trade investments (13,338) (12,671)
Revenue (GAAP measure) 31,104 29,350 6.0
Proportionate EBITDA 16,882 16,380
Mobile telecommunications 16,592 16,186
Other operations 290 194
Minority share in subsidiary undertakings 279 224
Group share in associated undertakings
and trade investments (5,201) (4,838)
Depreciation and amortisation (5,111) (4,709)
Loss on disposal of property, plant
and equipment (43) (69)
Share of results in associated
undertakings 2,728 2,428
Impairment losses (11,600) (23,515)
Other income and expense 502 15
Operating loss (GAAP measure) (1,564) (14,084)
Percentage
points
Proportionate mobile EBITDA margin 39.2% 40.2% (1.0)
Organic growth rates in proportionate mobile revenue and EBITDA margin in
the 2007 financial year are reconciled to reported growth rates as follows:
EBITDA
margin
Revenue Percentage
% points
Reported growth 5.1 (1.0)
Impact of acquisitions, disposals and foreign
exchange movements 1.2 0.1
Organic growth 6.3 (0.9)