Vodafone 2007 Annual Report Download - page 113
Download and view the complete annual report
Please find page 113 of the 2007 Vodafone annual report below. You can navigate through the pages in the report by either clicking on the pages listed below, or by using the keyword search tool below to find specific information within the annual report.-
 1
1 -
2
-
3
-
4
-
5
-
6
-
7
-
8
-
9
-
10
-
11
-
12
-
13
-
14
-
15
-
16
-
17
-
18
-
19
-
20
-
21
-
22
-
23
-
24
-
25
-
26
-
27
-
28
-
29
-
30
-
31
-
32
-
33
-
34
-
35
-
36
-
37
-
38
-
39
-
40
-
41
-
42
-
43
-
44
-
45
-
46
-
47
-
48
-
49
-
50
-
51
-
52
-
53
-
54
-
55
-
56
-
57
-
58
-
59
-
60
-
61
-
62
-
63
-
64
-
65
-
66
-
67
-
68
-
69
-
70
-
71
-
72
-
73
-
74
-
75
-
76
-
77
-
78
-
79
-
80
-
81
-
82
-
83
-
84
-
85
-
86
-
87
-
88
-
89
-
90
-
91
-
92
-
93
-
94
-
95
-
96
-
97
-
98
-
99
-
100
-
101
-
102
-
 103
103 -
 104
104 -
 105
105 -
 106
106 -
 107
107 -
 108
108 -
 109
109 -
 110
110 -
 111
111 -
 112
112 -
 113
113 -
 114
114 -
 115
115 -
 116
116 -
 117
117 -
 118
118 -
 119
119 -
 120
120 -
 121
121 -
 122
122 -
 123
123 -
124
-
125
-
126
-
127
-
128
-
129
-
130
-
131
-
132
-
133
-
134
-
135
-
136
-
137
-
138
-
139
-
140
-
141
-
142
-
143
-
144
-
145
-
146
-
147
-
148
-
149
-
150
-
151
-
152
-
153
-
154
-
155
-
156
-
157
-
158
-
159
-
160
-
161
-
162
-
163
-
164
 |
 |

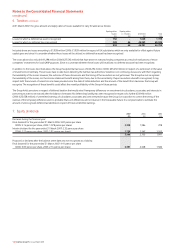
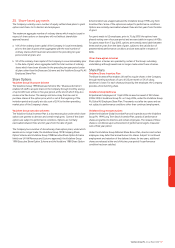
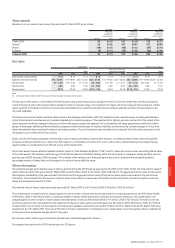
Key assumptions for the Group’s operations in Germany and Italy are disclosed below under “Sensitivity to changes in assumptions”. During the year ended
31 March 2007, the most recent value in use calculation for Group’s operations in Spain was based on a pre-tax risk adjusted discount rate of 9.7%
(2006: 9.0%) and long term growth rate of 3.2% (2006: 3.3%).
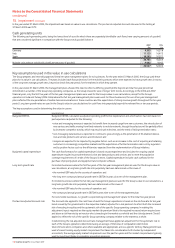
Sensitivity to changes in assumptions
Other than as disclosed below, management believes that no reasonably possible change in any of the above key assumptions would cause the carrying
value of any cash generating unit to exceed its recoverable amount.
Germany
At 31 March 2007, the fair value of the Group’s operations in Germany equalled its carrying value (2006: equalled) and consequently, any adverse change in a
key assumption may cause a further impairment loss to be recognised.
The most recent value in use calculation during the year ended 31 March 2007 was based on the following assumptions:
•Pre-tax risk adjusted discount rate of 10.6% (2006: 10.1%).
•Long term growth rate of 1.2% (2006: 1.1%).
•Budgeted EBITDA, expressed as the compound annual growth rates in the initial five years of the Group’s approved financial plans, of (4.2)% (2006: 0.3%).
•Budgeted capital expenditure, expressed as the range of capital expenditure as a percentage of revenue in the initial five years of the Group’s approved plans,
of 7.5 – 7.0% (2006: 9.3 – 9.0%).
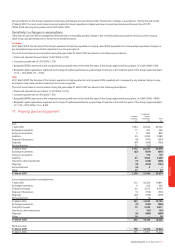
Italy
At 31 March 2007, the fair value of the Group’s operations in Italy equalled its carrying value (2006: equalled) and consequently, any adverse change in a key
assumption may cause a further impairment loss to be recognised.
The most recent value in use calculation during the year ended 31 March 2007 was based on the following assumptions:
•Pre-tax risk adjusted discount rate of 11.5% (2006: 10.1%).
•Long term growth rate of 1.0% (2006: 1.5%).
•Budgeted EBITDA, expressed as the compound annual growth rates in the initial five years of the Group’s approved financial plans, of (3.8)% (2006: (1.8)%).
•Budgeted capital expenditure, expressed as the range of capital expenditure as a percentage of revenue in the initial five years of the Group’s approved plans,
of 11.4% – 8.7% (2006: 13.4 – 8.5%).
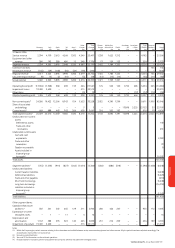
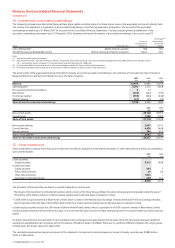
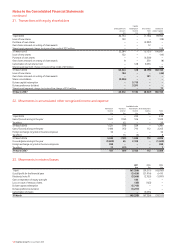
11. Property, plant and equipment
Equipment,
Land and fixtures
buildings and fittings Total
£m £m £m
Cost:
1 April 2005 1,094 22,672 23,766
Exchange movements 11 451 462
Arising on acquisition 3 896 899
Additions 55 3,334 3,389
Disposal of businesses (6) (931) (937)
Disposals (67) (669) (736)
Reclassifications 22 (22) –
31 March 2006 1,112 25,731 26,843
Exchange movements (22) (839) (861)
Arising on acquisition – 172 172
Additions 87 3,322 3,409
Transfer to other investments (1) (268) (269)
Disposals (9) (692) (701)
Reclassifications (4) 4 –
Other 77 – 77
31 March 2007 1,240 27,430 28,670
Accumulated depreciation and impairment:
1 April 2005 312 10,529 10,841
Exchange movements 3 222 225
Charge for the year 62 3,017 3,079
Disposal of businesses (1) (356) (357)
Disposals (26) (579) (605)
Reclassifications 3 (3) –
31 March 2006 353 12,830 13,183
Exchange movements (7) (349) (356)
Charge for the year 72 2,939 3,011
Transfer to other investments – (31) (31)
Disposals (4) (605) (609)
Other 28 – 28
31 March 2007 442 14,784 15,226
Net book value:
31 March 2007 798 12,646 13,444
31 March 2006 759 12,901 13,660
Vodafone Group Plc Annual Report 2007 111
Financials