Vodafone 2007 Annual Report Download - page 104
Download and view the complete annual report
Please find page 104 of the 2007 Vodafone annual report below. You can navigate through the pages in the report by either clicking on the pages listed below, or by using the keyword search tool below to find specific information within the annual report.-
 1
1 -
2
-
3
-
4
-
5
-
6
-
7
-
8
-
9
-
10
-
11
-
12
-
13
-
14
-
15
-
16
-
17
-
18
-
19
-
20
-
21
-
22
-
23
-
24
-
25
-
26
-
27
-
28
-
29
-
30
-
31
-
32
-
33
-
34
-
35
-
36
-
37
-
38
-
39
-
40
-
41
-
42
-
43
-
44
-
45
-
46
-
47
-
48
-
49
-
50
-
51
-
52
-
53
-
54
-
55
-
56
-
57
-
58
-
59
-
60
-
61
-
62
-
63
-
64
-
65
-
66
-
67
-
68
-
69
-
70
-
71
-
72
-
73
-
74
-
75
-
76
-
77
-
78
-
79
-
80
-
81
-
82
-
83
-
84
-
85
-
86
-
87
-
88
-
89
-
90
-
91
-
92
-
93
-
 94
94 -
 95
95 -
 96
96 -
 97
97 -
 98
98 -
 99
99 -
 100
100 -
 101
101 -
 102
102 -
 103
103 -
 104
104 -
 105
105 -
 106
106 -
 107
107 -
 108
108 -
 109
109 -
 110
110 -
 111
111 -
 112
112 -
 113
113 -
 114
114 -
115
-
116
-
117
-
118
-
119
-
120
-
121
-
122
-
123
-
124
-
125
-
126
-
127
-
128
-
129
-
130
-
131
-
132
-
133
-
134
-
135
-
136
-
137
-
138
-
139
-
140
-
141
-
142
-
143
-
144
-
145
-
146
-
147
-
148
-
149
-
150
-
151
-
152
-
153
-
154
-
155
-
156
-
157
-
158
-
159
-
160
-
161
-
162
-
163
-
164
 |
 |
102 Vodafone Group Plc Annual Report 2007
Notes to the Consolidated Financial Statements
continued
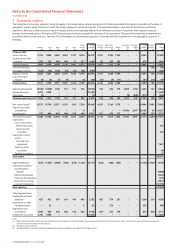
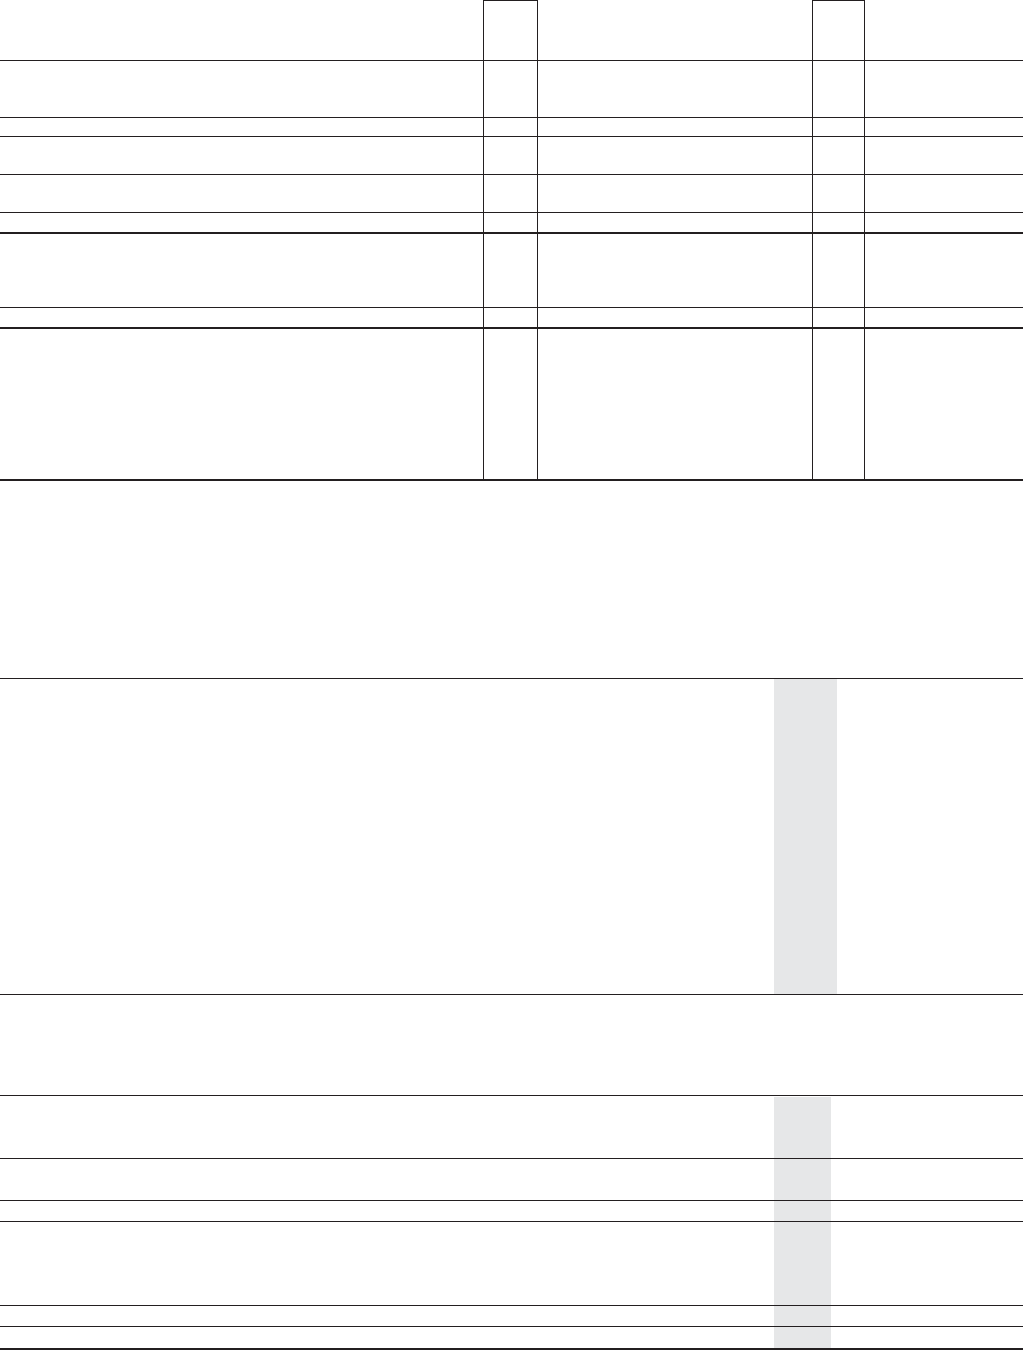
3. Segmental analysis continued
Middle Discon-
Other Total Eastern East, Africa Associates Associates Total Common Continuing tinued
Germany Italy Spain UK Arcor
(1)
Europe – Europe Europe & Asia Pacific – US – Other – EMAPA Functions operations operations
£m £m £m £m £m £m £m £m £m £m £m £m £m £m £m £m
31 March 2005
Service revenue 5,320 4,091 2,963 4,498 1,090 4,258 22,220 536 1,131 1,042 – – 2,709 – 24,929 5,610
Equipment and other revenue 364 182 298 567 5 386 1,802 37 137 104 – – 278 – 2,080 1,786
Segment revenue 5,684 4,273 3,261 5,065 1,095 4,644 24,022 573 1,268 1,146 – – 2,987 – 27,009 7,396
Common functions 123 123
Intra-region revenue (153) (32) (77) (40) (45) (61) (408) ––––– –(2)(410) (1)
Regional revenue 5,531 4,241 3,184 5,025 1,050 4,583 23,614 573 1,268 1,146 – – 2,987 121 26,722 7,395
Less: Inter-region revenue (5) (3) (1) (8) (2) (2) (21) (5) (8) (6) – – (19) (4) (44) –
Group revenue 5,526 4,238 3,183 5,017 1,048 4,581 23,593 568 1,260 1,140 – – 2,968 117 26,678 7,395
Operating profit/(loss) 1,473 1,694 775 779 64 533 5,318 90 375 200 1,354 626 2,645 (85) 7,878 664
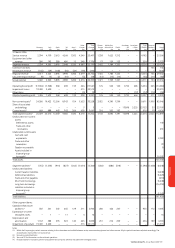
Add back:
Impairment losses –––––475475 ––––– – –475–
Adjusted operating profit 1,473 1,694 775 779 64 1,008 5,793 90 375 200 1,354 626 2,645 (85) 8,353 664
Other segment items:
Capitalised fixed asset
additions(2) 827 538 490 789 112 712 3,468 140 235 246 – – 621 136 4,225 885
Expenditure on other
intangible assets – 8–––– 83187–––118 –126–
Depreciation and amortisation 1,154 587 354 932 153 676 3,856 87 160 180 – – 427 18 4,301 1,214
Impairment of goodwill –––––475475 ––––– – –475–
Notes:
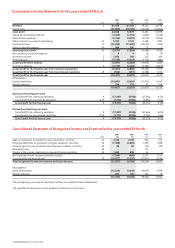
(1) Within the Europe region, certain revenues relating to Arcor have been reclassified between service revenue and equipment and other revenue. All prior periods have been adjusted accordingly. The
reclassification had no effect on total revenue.
(2) Includes additions to property, plant and equipment and computer software, included within intangible assets.
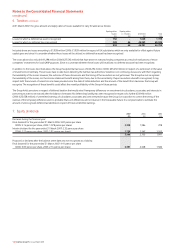
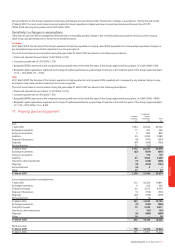
4. Operating (loss)/profit
Operating (loss)/profit has been arrived at after charging/(crediting):
2007 2006 2005
£m £m £m
Net foreign exchange losses/(gains) 6– (10)
Depreciation of property, plant and equipment (note 11):
Owned assets 2,994 3,069 2,871
Leased assets 17 10 14
Amortisation of intangible assets (note 9) 2,100 1,625 1,416
Impairment of goodwill 11,600 23,515 475
Research and development expenditure 222 206 198
Advertising costs 865 670 660
Staff costs (note 34) 2,466 2,310 2,185
Operating lease rentals payable:
Plant and machinery 35 35 37
Other assets including fixed line rentals 984 933 873
Loss on disposal of property, plant and equipment 43 69 68
Own costs capitalised attributable to the construction
or acquisition of property, plant and equipment (244) (256) (250)
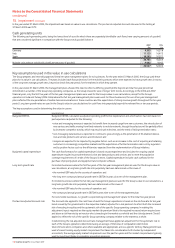
The total remuneration of the Group’s auditor, Deloitte & Touche LLP, and its affiliates for services provided to the Group’s subsidiary undertakings is
analysed below:
2007 2006 2005
£m £m £m
Audit fees:
Parent company 111
Subsidiary undertakings 433
544
Fees for statutory and regulatory filings(1) 2––
Audit and audit-related fees 744
Other fees:
Taxation 111
Corporate finance transactions –11
Other(2) 221
343
Total fees 10 87
Notes:
(1) Amounts for 2007 include mainly audit fees in relation to Section 404 of the US Sarbanes-Oxley Act of 2002.
(2) Amounts for 2007, 2006 and 2005 include fees mainly relating to the preparatory work required in advance of the implementation of Section 404 of the US Sarbanes-Oxley Act of 2002 and general
accounting advice.