Vodafone 2007 Annual Report Download - page 52
Download and view the complete annual report
Please find page 52 of the 2007 Vodafone annual report below. You can navigate through the pages in the report by either clicking on the pages listed below, or by using the keyword search tool below to find specific information within the annual report.-
 1
1 -
2
-
3
-
4
-
5
-
6
-
7
-
8
-
9
-
10
-
11
-
12
-
13
-
14
-
15
-
16
-
17
-
18
-
19
-
20
-
21
-
22
-
23
-
24
-
25
-
26
-
27
-
28
-
29
-
30
-
31
-
32
-
33
-
34
-
35
-
36
-
37
-
38
-
39
-
40
-
41
-
 42
42 -
 43
43 -
 44
44 -
 45
45 -
 46
46 -
 47
47 -
 48
48 -
 49
49 -
 50
50 -
 51
51 -
 52
52 -
 53
53 -
 54
54 -
 55
55 -
 56
56 -
 57
57 -
 58
58 -
 59
59 -
 60
60 -
 61
61 -
 62
62 -
63
-
64
-
65
-
66
-
67
-
68
-
69
-
70
-
71
-
72
-
73
-
74
-
75
-
76
-
77
-
78
-
79
-
80
-
81
-
82
-
83
-
84
-
85
-
86
-
87
-
88
-
89
-
90
-
91
-
92
-
93
-
94
-
95
-
96
-
97
-
98
-
99
-
100
-
101
-
102
-
103
-
104
-
105
-
106
-
107
-
108
-
109
-
110
-
111
-
112
-
113
-
114
-
115
-
116
-
117
-
118
-
119
-
120
-
121
-
122
-
123
-
124
-
125
-
126
-
127
-
128
-
129
-
130
-
131
-
132
-
133
-
134
-
135
-
136
-
137
-
138
-
139
-
140
-
141
-
142
-
143
-
144
-
145
-
146
-
147
-
148
-
149
-
150
-
151
-
152
-
153
-
154
-
155
-
156
-
157
-
158
-
159
-
160
-
161
-
162
-
163
-
164
 |
 |

50 Vodafone Group Plc Annual Report 2007
Operating Results
continued
organic increase was a consequence of the rapid growth in the Group’s
operations in Eastern Europe.
Middle East, Africa and Asia
Adjusted operating profit increased by 39.5%, or by 31.8% on an organic
basis. This increase was largely a result of the growth experienced in Egypt
and South Africa. In the Middle East, Africa and Asia region, total costs fell to
69.0% of total revenue compared to 71.0% in the 2005 financial year.
Pacific
Adjusted operating profit in the Pacific region declined by 30.0% largely due
to increased competition in Australia, where the launch of capped price
plans led to a large increase in voice usage which impacted interconnect
costs. Additionally, higher depreciation and purchased licence amortisation
charges were incurred during the year ended 31 March 2006 due to the
launch of 3G services in Australia and New Zealand.
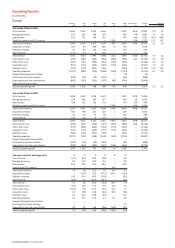
Associates
2006 % change
Verizon Verizon
Wireless Other Total Wireless
Share of result of associates £m £m £m £ $
Operating profit 2,112 1,010 3,122 25.5 21.5
Interest (204) (23) (227) 9.1 5.4
Tax (116) (329) (445) 27.5 22.5
Minority interest (60) 8 (52) 17.6 14.9
1,732 666 2,398 27.9 23.8
2005
Verizon
Wireless Other Total
Share of result of associates £m £m £m
Operating profit 1,683 985 2,668
Interest (187) (10) (197)
Tax (91) (357) (448)
Minority interest (51) 8 (43)
1,354 626 1,980
The US mobile telecommunications market saw continued significant
growth in customer numbers in the 2006 financial year, with penetration
reaching an estimated 72% at 31 March 2006. In this environment, Verizon
Wireless continued to increase its market share and improve its market
leading margin performance.
Verizon Wireless outperformed its competitors with record net additions,
increasing the proportionate customer base by 16.6% over the 2006
financial year to 23,530,000 and improving customer market share to
approximately 25% whilst also maintaining the proportion of contract
customers at 94.5% of the total customer base at 31 March 2006. The
strong customer performance benefited from continuing improvements in
customer loyalty, with a reduction in blended churn of 2.5 percentage
points to 14.7% compared with the 2005 financial year, the lowest in the
US mobile telecommunications industry.
In local currency, Verizon Wireless’ revenue increased by 14.9% due to the
strong customer growth, partially offset by a fall in ARPU of 1.9%. The ARPU
decline primarily resulted from an increase in the proportion of family share
customers and voice tariff pricing changes implemented early in 2005,
which included increases in the size of bundled minute plans.
The EMAPA region continued to grow strongly due to a combination of a
focus on existing operations where the potential for creating additional
value is strong, as well as the contribution of stake increases in South Africa
and Romania and acquisitions during the 2006 financial year in India and
the Czech Republic.
Revenue
Total revenue increased by 52.5%, or by 19.4% on an organic basis, driven
by organic service revenue growth of 20.9%. The stake increases in Romania
and South Africa and the acquisitions in India and the Czech Republic
increased reported total revenue by 26.5%, while favourable exchange rates
increased total revenue growth by 6.6%.
Eastern Europe
The key drivers behind the growth in service revenue in Eastern Europe were
the acquisitions in the Czech Republic and the increase in the Group’s stake
in Romania. On an organic basis, service revenue growth of 25.7% was
achieved, primarily due to strong service revenue growth of 39.0% in local
currency in Romania, which assumes the Group’s increased equity interest
was reflected in the whole of the 2006 and 2005 financial years.
Middle East, Africa and Asia
Service revenue growth was 43.7%, or 26.0% on an organic basis. The
increased stake in South Africa and the acquisition in India were responsible
for an 11.6% increase in service revenue. The organic increase was
predominantly a result of a rise in the average prepaid customer base of
82.0% in Egypt, which was driven by new innovative tariffs improving access
and affordability in the market place, and resulted in service revenue growth
in Egypt of 36.2%. Organic growth in South Africa was 21.8%, mostly a result
of significant prepaid additions which contributed to an increase in total
voice usage of 23.6%.
Pacific
Service revenue growth was 16.3%, or 10.3% on an organic basis. In
Australia the popularity of the capped plans had resulted in a significant
49.0% increase in total voice usage and an increase in its customer base of
16.0%, resulting in local currency service revenue growth of 11.8%. 3G
services were launched on 31 October 2005, with strong uptake resulting in
171,000 consumer 3G devices being registered on the network by 31 March
2006.
New Zealand achieved service revenue growth of 8.5%, driven by a 12.3%
growth in the average customer base, due principally to the launch of
competitive promotions during the 2006 financial year. 3G services were
launched on 10 August 2005, with 103,000 3G devices registered by the
end of the financial year.
Adjusted operating profit
Adjusted operating profit increased by 22.4%, or by 18.0% on an organic
basis. Favourable exchange rates increased growth by 3.5%, while the
impact of the increased stakes in Romania and South Africa and the
acquisitions in India and the Czech Republic increased growth by 0.9%.
Eastern Europe
Adjusted operating profit increased by 95.6%, or by 30.5% on an organic
basis. The acquisition in the Czech Republic and the increased stake in
Romania contributed 52.8% of the growth in the region, whereas the
Mobile telecommunications KPIs
2006 2005
Eastern Middle East, Eastern Middle East,
Europe Africa & Asia Pacific EMAPA Europe Africa & Asia Pacific EMAPA
Closing customers (’000) 12,579 21,884 5,346 39,809 4,188 10,560 4,698 19,446
Average monthly ARPU £10.8 £9.0 £19.7 £11.7 £10.7 £19.6
Annualised blended churn (%) 23.6% 34.6% 39.2% 24.3% 23.3% 36.7%
Closing 3G devices (’000) 135 −281 416 −−−−
Voice usage (millions of minutes) 13,302 18,300 9,811 41,413 4,500 11,658 7,078 23,236
See page 159 for definition of terms