Vodafone 2007 Annual Report Download - page 131
Download and view the complete annual report
Please find page 131 of the 2007 Vodafone annual report below. You can navigate through the pages in the report by either clicking on the pages listed below, or by using the keyword search tool below to find specific information within the annual report.-
 1
1 -
2
-
3
-
4
-
5
-
6
-
7
-
8
-
9
-
10
-
11
-
12
-
13
-
14
-
15
-
16
-
17
-
18
-
19
-
20
-
21
-
22
-
23
-
24
-
25
-
26
-
27
-
28
-
29
-
30
-
31
-
32
-
33
-
34
-
35
-
36
-
37
-
38
-
39
-
40
-
41
-
42
-
43
-
44
-
45
-
46
-
47
-
48
-
49
-
50
-
51
-
52
-
53
-
54
-
55
-
56
-
57
-
58
-
59
-
60
-
61
-
62
-
63
-
64
-
65
-
66
-
67
-
68
-
69
-
70
-
71
-
72
-
73
-
74
-
75
-
76
-
77
-
78
-
79
-
80
-
81
-
82
-
83
-
84
-
85
-
86
-
87
-
88
-
89
-
90
-
91
-
92
-
93
-
94
-
95
-
96
-
97
-
98
-
99
-
100
-
101
-
102
-
103
-
104
-
105
-
106
-
107
-
108
-
109
-
110
-
111
-
112
-
113
-
114
-
115
-
116
-
117
-
118
-
119
-
120
-
 121
121 -
 122
122 -
 123
123 -
 124
124 -
 125
125 -
 126
126 -
 127
127 -
 128
128 -
 129
129 -
 130
130 -
 131
131 -
 132
132 -
 133
133 -
 134
134 -
 135
135 -
 136
136 -
 137
137 -
 138
138 -
 139
139 -
 140
140 -
 141
141 -
142
-
143
-
144
-
145
-
146
-
147
-
148
-
149
-
150
-
151
-
152
-
153
-
154
-
155
-
156
-
157
-
158
-
159
-
160
-
161
-
162
-
163
-
164
 |
 |
Vodafone Group Plc Annual Report 2007 129
Financials
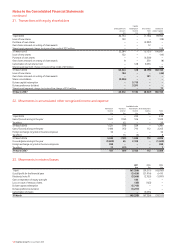
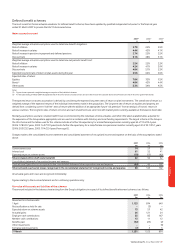
26. Provisions Asset
retirement Other
obligations Legal provisions Total
£m £m £m £m
1 April 2005 135 188 199 522
Exchange movements 43310
Amounts capitalised in the year 14 – – 14
Amounts charged to the income statement – 1 38 39
Utilised in the year – payments (3) (74) (77) (154)
Amounts released to the income statement (2) (19) (6) (27)
31 March 2006 148 99 157 404
Exchange movements (4) (2) (6) (12)
Amounts capitalised in the year 17 – – 17
Amounts charged to the income statement – 34 186 220
Utilised in the year – payments (2) (11) (45) (58)
Amounts released to the income statement – (4) (4) (8)
31 March 2007 159 116 288 563
Provisions have been analysed between current and non-current as follows:
2007 2006
£m £m
Current liabilities 267 139
Non-current liabilities 296 265
563 404
Asset retirement obligations
In the course of the Group’s activities, a number of sites and other assets are utilised which are expected to have costs associated with exiting and ceasing
their use. The associated cash outflows are generally expected to occur at the dates of exit of the assets to which they relate, which are long term in nature.
Legal
The Group is involved in a number of legal and other disputes, including notification of possible claims. The directors of the Company, after taking legal
advice, have established provisions after taking into account the facts of each case. The timing of cash outflows associated with legal claims cannot be
reasonably determined. For a discussion of certain legal issues potentially affecting the Group, refer to note 31 “Contingent liabilities”.
Other provisions
Included within other provisions are amounts provided for property and restructuring costs. The associated cash outflows for restructuring costs are
substantially short term in nature. The timing of the cash flows associated with property is dependent upon the remaining term of the associated lease.
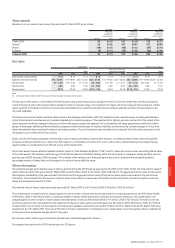
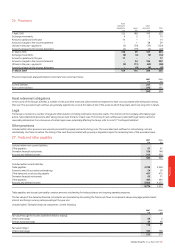
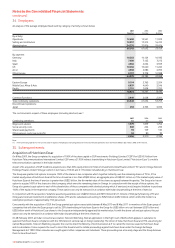
27. Trade and other payables
2007 2006
£m £m
Included within non-current liabilities:
Other payables 67 61
Derivative financial instruments 156 148
Accruals and deferred income 312 357
535 566
Included within current liabilities:
Trade payables 2,238 2,248
Amounts owed to associated undertakings 24 29
Other taxes and social security payable 467 412
Derivative financial instruments 63 71
Other payables 480 440
Accruals and deferred income 5,502 4,277
8,774 7,477
Trade payables and accruals principally comprise amounts outstanding for trade purchases and ongoing operating expenses.
The fair values of the derivative financial instruments are calculated by discounting the future cash flows to net present values using appropriate market
interest and foreign currency rates prevailing at the year end.
Included within “Derivative financial instruments” are the following:
2007 2006
£m £m
Fair value through the income statement (held for trading):
Interest rate swaps 68 2
Foreign exchange swaps 48 69
116 71
Fair value hedges:
Interest rate swaps 103 148
219 219