Vodafone 2007 Annual Report Download - page 94
Download and view the complete annual report
Please find page 94 of the 2007 Vodafone annual report below. You can navigate through the pages in the report by either clicking on the pages listed below, or by using the keyword search tool below to find specific information within the annual report.-
 1
1 -
2
-
3
-
4
-
5
-
6
-
7
-
8
-
9
-
10
-
11
-
12
-
13
-
14
-
15
-
16
-
17
-
18
-
19
-
20
-
21
-
22
-
23
-
24
-
25
-
26
-
27
-
28
-
29
-
30
-
31
-
32
-
33
-
34
-
35
-
36
-
37
-
38
-
39
-
40
-
41
-
42
-
43
-
44
-
45
-
46
-
47
-
48
-
49
-
50
-
51
-
52
-
53
-
54
-
55
-
56
-
57
-
58
-
59
-
60
-
61
-
62
-
63
-
64
-
65
-
66
-
67
-
68
-
69
-
70
-
71
-
72
-
73
-
74
-
75
-
76
-
77
-
78
-
79
-
80
-
81
-
82
-
83
-
 84
84 -
 85
85 -
 86
86 -
 87
87 -
 88
88 -
 89
89 -
 90
90 -
 91
91 -
 92
92 -
 93
93 -
 94
94 -
 95
95 -
 96
96 -
 97
97 -
 98
98 -
 99
99 -
 100
100 -
 101
101 -
 102
102 -
 103
103 -
 104
104 -
105
-
106
-
107
-
108
-
109
-
110
-
111
-
112
-
113
-
114
-
115
-
116
-
117
-
118
-
119
-
120
-
121
-
122
-
123
-
124
-
125
-
126
-
127
-
128
-
129
-
130
-
131
-
132
-
133
-
134
-
135
-
136
-
137
-
138
-
139
-
140
-
141
-
142
-
143
-
144
-
145
-
146
-
147
-
148
-
149
-
150
-
151
-
152
-
153
-
154
-
155
-
156
-
157
-
158
-
159
-
160
-
161
-
162
-
163
-
164
 |
 |

92 Vodafone Group Plc Annual Report 2007
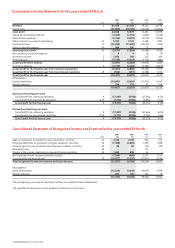
Consolidated Income Statement for the years ended 31 March
2007 2007 2006 2005
Note $m £m £m £m
Revenue 361,228 31,104 29,350 26,678
Cost of sales (36,860) (18,725) (17,070) (15,800)
Gross profit 24,368 12,379 12,280 10,878
Selling and distribution expenses (4,205) (2,136) (1,876) (1,649)
Administrative expenses (6,765) (3,437) (3,416) (2,856)
Share of result in associated undertakings 14 5,370 2,728 2,428 1,980
Impairment losses 10 (22,835) (11,600) (23,515) (475)
Other income and expense 29 988 502 15 –
Operating (loss)/profit 3,4 (3,079) (1,564) (14,084) 7,878
Non-operating income and expense 84(2) (7)
Investment income 5 1,553 789 353 294
Financing costs 5 (3,173) (1,612) (1,120) (880)
(Loss)/profit before taxation (4,691) (2,383) (14,853) 7,285
Income tax expense 6 (4,770) (2,423) (2,380) (1,869)
(Loss)/profit for the financial year from continuing operations (9,461) (4,806) (17,233) 5,416
(Loss)/profit for the financial year from discontinued operations 29 (966) (491) (4,588) 1,102
(Loss)/profit for the financial year (10,427) (5,297) (21,821) 6,518
Attributable to:
Equity shareholders (10,681) (5,426) (21,916) 6,410
Minority interests 254 129 95 108
(10,427) (5,297) (21,821) 6,518
Basic (loss)/earnings per share
(Loss)/profit from continuing operations 8 (17.60)¢ (8.94)p (27.66)p 8.12p
(Loss)/profit from discontinued operations 8, 29 (1.77)¢ (0.90)p (7.35)p 1.56p
(Loss)/profit for the financial year 8(19.37)¢ (9.84)p (35.01)p 9.68p
Diluted (loss)/earnings per share
(Loss)/profit from continuing operations 8 (17.60)¢ (8.94)p (27.66)p 8.09p
(Loss)/profit from discontinued operations 8, 29 (1.77)¢ (0.90)p (7.35)p 1.56p
(Loss)/profit for the financial year 8(19.37)¢ (9.84)p (35.01)p 9.65p
Consolidated Statement of Recognised Income and Expense for the years ended 31 March
2007 2007 2006 2005
Note $m £m £m £m
Gains on revaluation of available-for-sale investments, net of tax 22 4,150 2,108 705 106
Exchange differences on translation of foreign operations, net of tax 22 (7,488) (3,804) 1,494 1,488
Actuarial gains/(losses) on defined benefit pension schemes, net of tax 22 98 50 (30) (79)
Revaluation gain 22 – – 112 –
Transfer to the income statement on disposal of foreign operations 22 1,650 838 36 –
Net (expense)/income recognised directly in equity (1,590) (808) 2,317 1,515
(Loss)/profit for the financial year 23 (10,427) (5,297) (21,821) 6,518
Total recognised income and expense relating to the year (12,017) (6,105) (19,504) 8,033
Attributable to:
Equity shareholders (12,224) (6,210) (19,607) 7,958
Minority interests 207 105 103 75
(12,017) (6,105) (19,504) 8,033
The accompanying notes are an integral part of these Consolidated Financial Statements.
The unaudited US dollar amounts are prepared on the basis set out in note 1.