Vodafone 2007 Annual Report Download - page 124
Download and view the complete annual report
Please find page 124 of the 2007 Vodafone annual report below. You can navigate through the pages in the report by either clicking on the pages listed below, or by using the keyword search tool below to find specific information within the annual report.-
 1
1 -
2
-
3
-
4
-
5
-
6
-
7
-
8
-
9
-
10
-
11
-
12
-
13
-
14
-
15
-
16
-
17
-
18
-
19
-
20
-
21
-
22
-
23
-
24
-
25
-
26
-
27
-
28
-
29
-
30
-
31
-
32
-
33
-
34
-
35
-
36
-
37
-
38
-
39
-
40
-
41
-
42
-
43
-
44
-
45
-
46
-
47
-
48
-
49
-
50
-
51
-
52
-
53
-
54
-
55
-
56
-
57
-
58
-
59
-
60
-
61
-
62
-
63
-
64
-
65
-
66
-
67
-
68
-
69
-
70
-
71
-
72
-
73
-
74
-
75
-
76
-
77
-
78
-
79
-
80
-
81
-
82
-
83
-
84
-
85
-
86
-
87
-
88
-
89
-
90
-
91
-
92
-
93
-
94
-
95
-
96
-
97
-
98
-
99
-
100
-
101
-
102
-
103
-
104
-
105
-
106
-
107
-
108
-
109
-
110
-
111
-
112
-
113
-
 114
114 -
 115
115 -
 116
116 -
 117
117 -
 118
118 -
 119
119 -
 120
120 -
 121
121 -
 122
122 -
 123
123 -
 124
124 -
 125
125 -
 126
126 -
 127
127 -
 128
128 -
 129
129 -
 130
130 -
 131
131 -
 132
132 -
 133
133 -
 134
134 -
135
-
136
-
137
-
138
-
139
-
140
-
141
-
142
-
143
-
144
-
145
-
146
-
147
-
148
-
149
-
150
-
151
-
152
-
153
-
154
-
155
-
156
-
157
-
158
-
159
-
160
-
161
-
162
-
163
-
164
 |
 |

122 Vodafone Group Plc Annual Report 2007
Notes to the Consolidated Financial Statements
continued
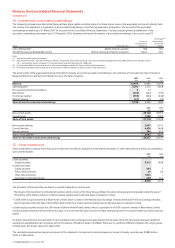
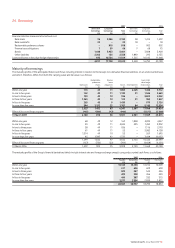
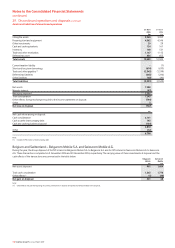
24. Borrowings continued
The currency split of the Group’s foreign exchange derivatives, all of which mature in less than one year, is as follows:
2007 2006
Payable Receivable Payable Receivable
£m £m £m £m
Sterling 1,000 5,477 – 2,971
Euro 7,204 – 6,387 157
US dollar 6,178 8,166 3,646 9,655
Japanese yen – 106 2,017 190
Other 84 747 1,323 361
14,466 14,496 13,373 13,334
Payables and receivables are stated separately in the table above as settlement is on a gross basis. The £30 million net receivable (2006: £39 million net
payable) in relation to foreign exchange financial instruments, in the table above, is split £48 million (2006: £69 million) within trade and other payables and
£78 million (2006: £30 million) within trade and other receivables.
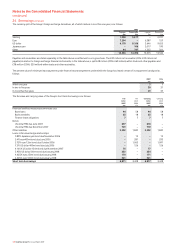
The present value of minimum lease payments under finance lease arrangements under which the Group has leased certain of its equipment is analysed as
follows:
2007 2006
£m £m
Within one year 77
In two to five years 30 31
In more than five years 29 37
The fair value and carrying value of the Group’s short term borrowings is as follows:
Fair Fair Carrying Carrying
value value value value
2007 2006 2007 2006
£m £m £m £m
Financial liabilities measured at amortised cost:
Bank loans 94 58 94 58
Bank overdrafts 23 18 23 18
Finance lease obligations 7777
Bonds:
US dollar FRN due June 2007 897 –878 –
US dollar FRN due December 2007 749 –770 –
Other liabilities 2,202 1,840 2,202 1,840
Loans in fair value hedge relationships:
0.83% Japanese yen bond due November 2006 –15 –15
5.4% euro400m bond due June 2006 –281 –293
5.75% euro1.5bn bond due October 2006 –1,063 –1,091
7.5% US dollar 400m bond due July 2006 –126 –126
4.161% US dollar 150m bond due November 2007 76 –77 –
3.95% US dollar 500m bond due January 2008 252 –254 –
4.625% euro 250m bond due January 2008 170 –171 –
4.625% euro 500m bond due January 2008 341 –341 –
Short term borrowings 4,811 3,408 4,817 3,448