Vodafone 2007 Annual Report Download - page 130
Download and view the complete annual report
Please find page 130 of the 2007 Vodafone annual report below. You can navigate through the pages in the report by either clicking on the pages listed below, or by using the keyword search tool below to find specific information within the annual report.-
 1
1 -
2
-
3
-
4
-
5
-
6
-
7
-
8
-
9
-
10
-
11
-
12
-
13
-
14
-
15
-
16
-
17
-
18
-
19
-
20
-
21
-
22
-
23
-
24
-
25
-
26
-
27
-
28
-
29
-
30
-
31
-
32
-
33
-
34
-
35
-
36
-
37
-
38
-
39
-
40
-
41
-
42
-
43
-
44
-
45
-
46
-
47
-
48
-
49
-
50
-
51
-
52
-
53
-
54
-
55
-
56
-
57
-
58
-
59
-
60
-
61
-
62
-
63
-
64
-
65
-
66
-
67
-
68
-
69
-
70
-
71
-
72
-
73
-
74
-
75
-
76
-
77
-
78
-
79
-
80
-
81
-
82
-
83
-
84
-
85
-
86
-
87
-
88
-
89
-
90
-
91
-
92
-
93
-
94
-
95
-
96
-
97
-
98
-
99
-
100
-
101
-
102
-
103
-
104
-
105
-
106
-
107
-
108
-
109
-
110
-
111
-
112
-
113
-
114
-
115
-
116
-
117
-
118
-
119
-
 120
120 -
 121
121 -
 122
122 -
 123
123 -
 124
124 -
 125
125 -
 126
126 -
 127
127 -
 128
128 -
 129
129 -
 130
130 -
 131
131 -
 132
132 -
 133
133 -
 134
134 -
 135
135 -
 136
136 -
 137
137 -
 138
138 -
 139
139 -
 140
140 -
141
-
142
-
143
-
144
-
145
-
146
-
147
-
148
-
149
-
150
-
151
-
152
-
153
-
154
-
155
-
156
-
157
-
158
-
159
-
160
-
161
-
162
-
163
-
164
 |
 |

128 Vodafone Group Plc Annual Report 2007
Notes to the Consolidated Financial Statements
continued
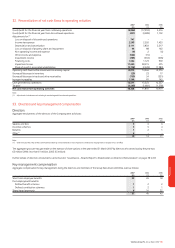
25. Post employment benefits continued
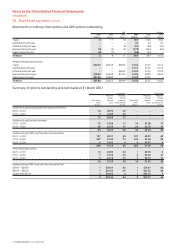
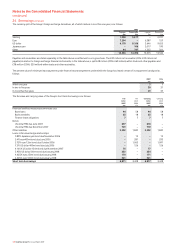
2007 2006 2005
£m £m £m
Movement in scheme liabilities:
1 April 1,224 998 794
Reclassification as held for sale –(31) –
Current service cost 74 57 58
Interest cost 61 52 42
Member cash contributions 13 11 12
Actuarial (gains)/losses (39) 164 126
Benefits paid (32) (27) (30)
Other movements 4(8) (9)
Exchange rate movements (13) 85
31 March 1,292 1,224 998
Accumulated benefit obligation 1,084 1,081 904
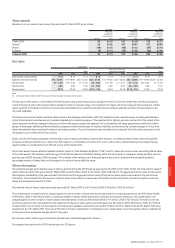
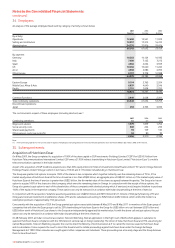
UK Other Total
2007 2006 2005 2007 2006 2005 2007 2006 2005
£m £m £m £m £m £m £m £m £m
Analysis of net assets/(deficits):
Total fair value of scheme assets 954 835 628 297 288 246 1,251 1,123 874
Present value of funded scheme liabilities (901) (847) (619) (293) (281) (299) (1,194) (1,128) (918)
Net assets/(deficits) for funded schemes 53 (12) 9 47 (53) 57 (5) (44)
Present value of unfunded scheme liabilities –––(98) (96) (80) (98) (96) (80)
Net assets/(deficits) 53 (12) 9 (94) (89) (133) (41) (101) (124)
Net assets/(deficits) are analysed as:
Assets 53 –929 19 3 82 19 12
Liabilities –(12) – (123) (108) (136) (123) (120) (136)
The funding policy for all schemes is reviewed on a systematic basis in consultation with the independent scheme actuary in order to ensure that the funding
contributions from sponsoring employers are appropriate to meet the liabilities of the schemes over the long term.
The deficit in respect of other schemes at 31 March 2007 primarily relates to various schemes in Germany and internally funded schemes in Italy and the
United States.
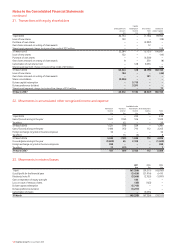
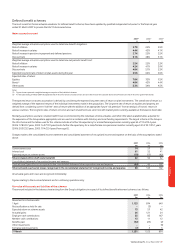
Actual return on scheme assets
2007 2006 2005
£m £m £m
Actual return on scheme assets 99 178 66
Analysis of scheme assets at 31 March is as follows: %% %
Equities 72.1 71.9 60.0
Bonds 27.5 26.5 25.9
Property 0.4 0.4 0.4
Other –1.2 13.7
100.0 100.0 100.0
The scheme has no investments in the Group’s equity securities or in property currently used by the Group.
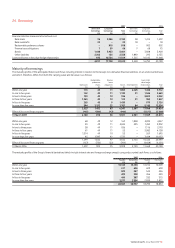
History of experience adjustments
2007 2006 2005
£m £m £m
Experience adjustments on scheme liabilities:
Amount (£m) (2) (4) (60)
Percentage of scheme liabilities (%) ––6%
Experience adjustments on scheme assets:
Amount (£m) 26 121 24
Percentage of scheme assets (%) 2% 11% 3%
Expected contributions and benefit payments
£m
Expected employer’s contributions in the year ending 31 March 2008 54
Expected benefit payments in the year ending 31 March:
2008 36
2009 35
2010 37
2011 38
2012 40
2013-2018 220