Vodafone 2007 Annual Report Download - page 4
Download and view the complete annual report
Please find page 4 of the 2007 Vodafone annual report below. You can navigate through the pages in the report by either clicking on the pages listed below, or by using the keyword search tool below to find specific information within the annual report.-
 1
1 -
 2
2 -
 3
3 -
 4
4 -
 5
5 -
 6
6 -
 7
7 -
 8
8 -
 9
9 -
 10
10 -
 11
11 -
 12
12 -
 13
13 -
 14
14 -
 15
15 -
16
-
17
-
18
-
19
-
20
-
21
-
22
-
23
-
24
-
25
-
26
-
27
-
28
-
29
-
30
-
31
-
32
-
33
-
34
-
35
-
36
-
37
-
38
-
39
-
40
-
41
-
42
-
43
-
44
-
45
-
46
-
47
-
48
-
49
-
50
-
51
-
52
-
53
-
54
-
55
-
56
-
57
-
58
-
59
-
60
-
61
-
62
-
63
-
64
-
65
-
66
-
67
-
68
-
69
-
70
-
71
-
72
-
73
-
74
-
75
-
76
-
77
-
78
-
79
-
80
-
81
-
82
-
83
-
84
-
85
-
86
-
87
-
88
-
89
-
90
-
91
-
92
-
93
-
94
-
95
-
96
-
97
-
98
-
99
-
100
-
101
-
102
-
103
-
104
-
105
-
106
-
107
-
108
-
109
-
110
-
111
-
112
-
113
-
114
-
115
-
116
-
117
-
118
-
119
-
120
-
121
-
122
-
123
-
124
-
125
-
126
-
127
-
128
-
129
-
130
-
131
-
132
-
133
-
134
-
135
-
136
-
137
-
138
-
139
-
140
-
141
-
142
-
143
-
144
-
145
-
146
-
147
-
148
-
149
-
150
-
151
-
152
-
153
-
154
-
155
-
156
-
157
-
158
-
159
-
160
-
161
-
162
-
163
-
164
 |
 |

2Vodafone Group Plc Annual Report 2007
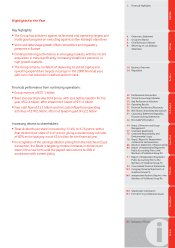
Financial Highlights
The selected financial data set out on the following pages is derived from the
Consolidated Financial Statements of the Company on pages 92 to 142 and
as such should be read in conjunction with them. Certain trends within the
financial data presented below have been impacted by business acquisitions
and disposals, the most significant of which are described in “Business –
Business Overview – How We Developed”. The Consolidated Financial
Statements are prepared in accordance with IFRS, on the basis set out in
note 1 to the Consolidated Financial Statements, which differ in certain
significant respects from US GAAP. For further details, see note 38 to the
Consolidated Financial Statements. Solely for convenience, amounts
represented below in dollars have been translated at $1.9685: £1, the
Noon Buying Rate on 30 March 2007.
At/year ended 31 March
2007 2007 2006 2005
$m £m £m £m
IFRS
Consolidated Income Statement Data
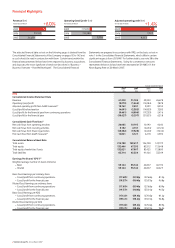
Revenue 61,228 31,104 29,350 26,678
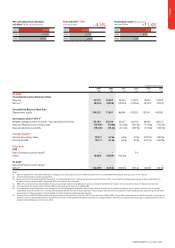
Operating (loss)/profit (3,079) (1,564) (14,084) 7,878
Adjusted operating profit (Non-GAAP measure)(1) 18,762 9,531 9,399 8,353
(Loss)/profit before taxation (4,691) (2,383) (14,853) 7,285
(Loss)/profit for the financial year from continuing operations (9,461) (4,806) (17,233) 5,416
(Loss)/profit for the financial year (10,427) (5,297) (21,821) 6,518
Consolidated Cash Flow Data(2)
Net cash flows from operating activities 20,065 10,193 10,190 9,240
Net cash flows from investing activities 8,132 4,131 (6,654) (4,122)
Net cash flows from financing activities (18,352) (9,323) (4,540) (7,242)
Free cash flow (Non-GAAP measure)(1) 12,061 6,127 6,418 6,592
Consolidated Balance Sheet Data
Total assets 215,780 109,617 126,738 147,197
Total equity 132,466 67,293 85,312 113,648
Total equity shareholders’ funds 132,021 67,067 85,425 113,800
Total liabilities 83,314 42,324 41,426 33,549
Earnings Per Share (“EPS”)(3)
Weighted average number of shares (millions)
– Basic 55,144 55,144 62,607 66,196
– Diluted 55,144 55,144 62,607 66,427
Basic (loss)/earnings per ordinary share
– (Loss)/profit from continuing operations (17.60)¢ (8.94)p (27.66)p 8.12p
– (Loss)/profit for the financial year (19.37)¢ (9.84)p (35.01)p 9.68p
Diluted (loss)/earnings per ordinary share
– (Loss)/profit from continuing operations (17.60)¢ (8.94)p (27.66)p 8.09p
– (Loss)/profit for the financial year (19.37)¢ (9.84)p (35.01)p 9.65p
Basic (loss)/earnings per ADS
– (Loss)/profit from continuing operations (176.0)¢ (89.4)p (276.6)p 81.2p
– (Loss)/profit for the financial year (193.7)¢ (98.4)p (350.1)p 96.8p
Diluted (loss)/earnings per ADS
– (Loss)/profit from continuing operations (176.0)¢ (89.4)p (276.6)p 80.9p
– (Loss)/profit for the financial year (193.7)¢ (98.4)p (350.1)p 96.5p
2007
2006
2005
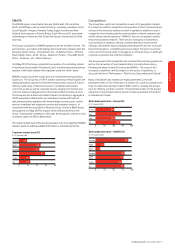
Revenue (£m)
Year ended 31 March +6.0%
31,104
29,350
26,678
2007
2006
2005
Operating (loss)/profit (£m)
Year ended 31 March
(1,564)
(14,084)
7,878
2007
2006
2005
Adjusted operating profit (£m)
Year ended 31 March +1.4%
9,531
9,399
8,353