Vodafone 2007 Annual Report Download - page 31
Download and view the complete annual report
Please find page 31 of the 2007 Vodafone annual report below. You can navigate through the pages in the report by either clicking on the pages listed below, or by using the keyword search tool below to find specific information within the annual report.-
 1
1 -
2
-
3
-
4
-
5
-
6
-
7
-
8
-
9
-
10
-
11
-
12
-
13
-
14
-
15
-
16
-
17
-
18
-
19
-
20
-
 21
21 -
 22
22 -
 23
23 -
 24
24 -
 25
25 -
 26
26 -
 27
27 -
 28
28 -
 29
29 -
 30
30 -
 31
31 -
 32
32 -
 33
33 -
 34
34 -
 35
35 -
 36
36 -
 37
37 -
 38
38 -
 39
39 -
 40
40 -
 41
41 -
42
-
43
-
44
-
45
-
46
-
47
-
48
-
49
-
50
-
51
-
52
-
53
-
54
-
55
-
56
-
57
-
58
-
59
-
60
-
61
-
62
-
63
-
64
-
65
-
66
-
67
-
68
-
69
-
70
-
71
-
72
-
73
-
74
-
75
-
76
-
77
-
78
-
79
-
80
-
81
-
82
-
83
-
84
-
85
-
86
-
87
-
88
-
89
-
90
-
91
-
92
-
93
-
94
-
95
-
96
-
97
-
98
-
99
-
100
-
101
-
102
-
103
-
104
-
105
-
106
-
107
-
108
-
109
-
110
-
111
-
112
-
113
-
114
-
115
-
116
-
117
-
118
-
119
-
120
-
121
-
122
-
123
-
124
-
125
-
126
-
127
-
128
-
129
-
130
-
131
-
132
-
133
-
134
-
135
-
136
-
137
-
138
-
139
-
140
-
141
-
142
-
143
-
144
-
145
-
146
-
147
-
148
-
149
-
150
-
151
-
152
-
153
-
154
-
155
-
156
-
157
-
158
-
159
-
160
-
161
-
162
-
163
-
164
 |
 |

Vodafone Group Plc Annual Report 2007 29
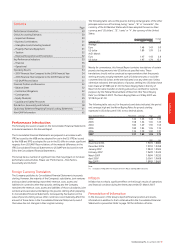
Performance
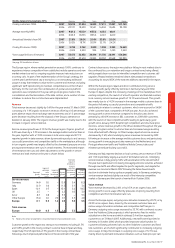
The following table sets out the pounds sterling exchange rates of the other
principal currencies of the Group, being: “euros”, “” or “eurocents”, the
currency of the EU Member States which have adopted the euro as their
currency, and “US dollars”, “$”, “cents” or “¢”, the currency of the United
States.
At / year ended 31 March Change
Currency (=£1) 2007 2006 %
Average:
Euro 1.48 1.47 0.7
US dollar 1.89 1.79 5.6
At 31 March:
Euro 1.47 1.43 2.8
US dollar 1.97 1.74 13.2
Merely for convenience, this Annual Report contains translations of certain
pounds sterling amounts into US dollars at specified rates. These
translations should not be construed as representations that the pounds
sterling amounts actually represent such US dollar amounts or could be
converted into US dollars at the rate indicated or at any other rate. Unless
otherwise indicated, the translations of pounds sterling into US dollars have
been made at $1.9685 per £1.00, the Noon Buying Rate in the City of
New York for cable transfers in sterling amounts as certified for customs
purposes by the Federal Reserve Bank of New York (the “Noon Buying
Rate”) on 30 March 2007. The Noon Buying Rate on 25 May 2007 was
$1.9845 per £1.00.
The following table sets out, for the periods and dates indicated, the period
end, average, high and low Noon Buying Rates for pounds sterling
expressed in US dollars per £1.00, to two decimal places.
Years ended 31 March Period end Average High Low
2002 1.42 1.43 1.48 1.37
2003 1.58 1.54 1.65 1.43
2004 1.84 1.69 1.90 1.55
2005 1.89 1.85 1.96 1.75
2006 1.74 1.79 1.92 1.71
2007 1.97 1.89 1.98 1.74
Month High Low
November 2006 1.9693 1.8883
December 2006 1.9794 1.9458
January 2007 1.9847 1.9305
February 2007 1.9699 1.9443
March 2007 1.9694 1.9235
April 2007 2.0061 1.9608
May 2007(1) 1.9993 1.9695
Note:
(1) In respect of May 2007, for the period from 1 May to 25 May 2007, inclusive.
Inflation
Inflation has not had a significant effect on the Group’s results of operations
and financial condition during the three years ended 31 March 2007.
Presentation of Information
In the discussion of the Group’s reported financial position and results,
information in addition to that contained within the Consolidated Financial
Statements is presented. Refer to page 159 for definition of terms.
Performance Introduction
The following discussion is based on the Consolidated Financial Statements
included elsewhere in this Annual Report.
The Consolidated Financial Statements are prepared in accordance with
IFRS as issued by the IASB and as adopted for use in the EU. IFRS as issued
by the IASB and IFRS as adopted for use in the EU differ in certain significant
respects from US GAAP. Reconciliations of the material differences in the
IFRS Consolidated Financial Statements to US GAAP are disclosed in note
38 to the Consolidated Financial Statements.
The Group faces a number of significant risks that may impact on its future
performance and activities. Please see “Performance – Risk Factors,
Seasonality and Outlook”.
Foreign Currency Translation
The Company publishes its Consolidated Financial Statements in pounds
sterling. However, the majority of the Company’s subsidiaries, joint ventures
and associated undertakings report their revenue, costs, assets and
liabilities in currencies other than pounds sterling and the Company
translates the revenue, costs, assets and liabilities of those subsidiaries, joint
ventures and associated undertakings into pounds sterling when preparing
its Consolidated Financial Statements. Consequently, fluctuations in the
value of pounds sterling versus other currencies could materially affect the
amount of these items in the Consolidated Financial Statements, even if
their value has not changed in their original currency.
Contents
Page
Performance Introduction 29
Critical Accounting Estimates 30
– Impairment Reviews 30
– Business Combinations 31
– Intangible Assets, Excluding Goodwill 31
– Property, Plant and Equipment 31
– Taxation 32
– Revenue Recognition and Presentation 32
Key Performance Indicators 33
– Financial 33
– Operational 33
Operating Results 34
– 2007 Financial Year Compared to the 2006 Financial Year 34
– 2006 Financial Year Compared to the 2005 Financial Year 44
– US GAAP Reconciliation 51
Financial Position and Resources 52
– Balance Sheet 52
– Contractual Obligations 52
– Contingencies 53
– Equity Dividends 53
– Liquidity and Capital Resources 53
Risk Factors, Seasonality and Outlook 58
Cautionary Statement Regarding Forward-Looking Statements 61
Non-GAAP Information 62