Travelers 2012 Annual Report Download - page 99
Download and view the complete annual report
Please find page 99 of the 2012 Travelers annual report below. You can navigate through the pages in the report by either clicking on the pages listed below, or by using the keyword search tool below to find specific information within the annual report.-
 1
1 -
2
-
3
-
4
-
5
-
6
-
7
-
8
-
9
-
10
-
11
-
12
-
13
-
14
-
15
-
16
-
17
-
18
-
19
-
20
-
21
-
22
-
23
-
24
-
25
-
26
-
27
-
28
-
29
-
30
-
31
-
32
-
33
-
34
-
35
-
36
-
37
-
38
-
39
-
40
-
41
-
42
-
43
-
44
-
45
-
46
-
47
-
48
-
49
-
50
-
51
-
52
-
53
-
54
-
55
-
56
-
57
-
58
-
59
-
60
-
61
-
62
-
63
-
64
-
65
-
66
-
67
-
68
-
69
-
70
-
71
-
72
-
73
-
74
-
75
-
76
-
77
-
78
-
79
-
80
-
81
-
82
-
83
-
84
-
85
-
86
-
87
-
88
-
 89
89 -
 90
90 -
 91
91 -
 92
92 -
 93
93 -
 94
94 -
 95
95 -
 96
96 -
 97
97 -
 98
98 -
 99
99 -
 100
100 -
 101
101 -
 102
102 -
 103
103 -
 104
104 -
 105
105 -
 106
106 -
 107
107 -
 108
108 -
 109
109 -
110
-
111
-
112
-
113
-
114
-
115
-
116
-
117
-
118
-
119
-
120
-
121
-
122
-
123
-
124
-
125
-
126
-
127
-
128
-
129
-
130
-
131
-
132
-
133
-
134
-
135
-
136
-
137
-
138
-
139
-
140
-
141
-
142
-
143
-
144
-
145
-
146
-
147
-
148
-
149
-
150
-
151
-
152
-
153
-
154
-
155
-
156
-
157
-
158
-
159
-
160
-
161
-
162
-
163
-
164
-
165
-
166
-
167
-
168
-
169
-
170
-
171
-
172
-
173
-
174
-
175
-
176
-
177
-
178
-
179
-
180
-
181
-
182
-
183
-
184
-
185
-
186
-
187
-
188
-
189
-
190
-
191
-
192
-
193
-
194
-
195
-
196
-
197
-
198
-
199
-
200
-
201
-
202
-
203
-
204
-
205
-
206
-
207
-
208
-
209
-
210
-
211
-
212
-
213
-
214
-
215
-
216
-
217
-
218
-
219
-
220
-
221
-
222
-
223
-
224
-
225
-
226
-
227
-
228
-
229
-
230
-
231
-
232
-
233
-
234
-
235
-
236
-
237
-
238
-
239
-
240
-
241
-
242
-
243
-
244
-
245
-
246
-
247
-
248
-
249
-
250
-
251
-
252
-
253
-
254
-
255
-
256
-
257
-
258
-
259
-
260
-
261
-
262
-
263
-
264
-
265
-
266
-
267
-
268
-
269
-
270
-
271
-
272
-
273
-
274
-
275
-
276
-
277
-
278
-
279
-
280
-
281
-
282
-
283
-
284
-
285
-
286
-
287
-
288
-
289
-
290
-
291
-
292
-
293
-
294
-
295
-
296
-
297
-
298
-
299
-
300
 |
 |
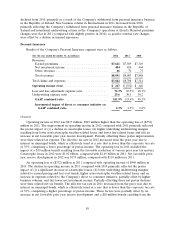
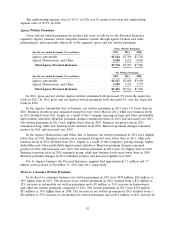
lower than in 2010. The decrease in 2012 was generally consistent with the decrease in earned
premiums, whereas the decrease in 2011 was less than the decrease in earned premiums, primarily due
to the increase to earned premiums in 2010 as a result of a reduction in surety reinsurance costs
associated with prior year reinsurance treaties.
General and Administrative Expenses
General and administrative expenses in 2012 were $667 million, $19 million or 3% higher than in
2011. General and administrative expenses were $648 million in 2011, $40 million or 7% higher than in
2010. The increases in both 2012 and 2011 primarily reflected increases in employee- and technology-
related costs to enhance operations and support future business growth.
Income Tax Expense
Income tax expense in 2012 was $255 million, compared to $230 million in 2011. The increase in
income tax expense of $25 million in 2012 from 2011 primarily reflected the impact of a $14 million
benefit in 2011 from the favorable resolution of various prior year tax matters and, to a lesser extent,
an increase in underwriting margins in 2012 from 2011.
Income tax expense in 2011 was $230 million, compared with $245 million in 2010. The decrease in
income tax of $15 million in 2011 from 2010 primarily reflected the impact of a $14 million benefit in
2011 from the favorable resolution of various prior year tax matters.
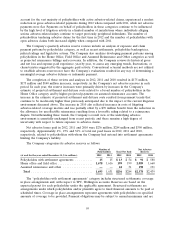
GAAP Combined Ratios
The GAAP combined ratio of 84.1% in 2012 was 1.7 points lower than the GAAP combined ratio
of 85.8% in 2011.
The loss and loss adjustment expense ratio of 42.8% in 2012 was 3.6 points lower than the loss and
loss adjustment expense ratio of 46.4% in 2011. The 2012 and 2011 ratios included 9.8 points and 11.3
points of benefit, respectively, from net favorable prior year reserve development. Catastrophe losses in
2012 and 2011 accounted for 1.7 points of the loss and loss adjustment expense ratio in each year. The
2012 underlying loss and loss adjustment expense ratio was 5.1 points lower than the 2011 ratio on the
same basis, reflecting the factors discussed above.
The underwriting expense ratio of 41.3% in 2012 was 1.9 points higher than the underwriting
expense ratio of 39.4% in 2011, primarily reflecting the impact of a decline in earned premiums and, to
a lesser extent, the impact of an increase in general and administrative expenses.
The GAAP combined ratio of 85.8% in 2011 was 1.9 points lower than the GAAP combined ratio
of 87.7% in 2010.
The loss and loss adjustment expense ratio of 46.4% in 2011 was 4.5 points lower than the 2010
ratio of 50.9%. Catastrophe losses in 2011 and 2010 accounted for 1.7 and 2.4 points of the loss and
loss adjustment expense ratio, respectively. Net favorable prior year reserve development provided 11.3
points and 7.8 points of benefit to the loss and loss adjustment expense ratio in 2011 and 2010,
respectively. The 2011 underlying loss and loss adjustment expense ratio was 0.3 points lower than the
2010 ratio on the same basis, reflecting the factors discussed above.
The underwriting expense ratio of 39.4% in 2011 was 2.6 points higher than the underwriting
expense ratio of 36.8% in 2010. The increase in 2011 primarily reflected lower earned premium
volumes in International and construction surety and the increase in general and administrative
expenses discussed above.
87