Travelers 2012 Annual Report Download - page 199
Download and view the complete annual report
Please find page 199 of the 2012 Travelers annual report below. You can navigate through the pages in the report by either clicking on the pages listed below, or by using the keyword search tool below to find specific information within the annual report.-
 1
1 -
2
-
3
-
4
-
5
-
6
-
7
-
8
-
9
-
10
-
11
-
12
-
13
-
14
-
15
-
16
-
17
-
18
-
19
-
20
-
21
-
22
-
23
-
24
-
25
-
26
-
27
-
28
-
29
-
30
-
31
-
32
-
33
-
34
-
35
-
36
-
37
-
38
-
39
-
40
-
41
-
42
-
43
-
44
-
45
-
46
-
47
-
48
-
49
-
50
-
51
-
52
-
53
-
54
-
55
-
56
-
57
-
58
-
59
-
60
-
61
-
62
-
63
-
64
-
65
-
66
-
67
-
68
-
69
-
70
-
71
-
72
-
73
-
74
-
75
-
76
-
77
-
78
-
79
-
80
-
81
-
82
-
83
-
84
-
85
-
86
-
87
-
88
-
89
-
90
-
91
-
92
-
93
-
94
-
95
-
96
-
97
-
98
-
99
-
100
-
101
-
102
-
103
-
104
-
105
-
106
-
107
-
108
-
109
-
110
-
111
-
112
-
113
-
114
-
115
-
116
-
117
-
118
-
119
-
120
-
121
-
122
-
123
-
124
-
125
-
126
-
127
-
128
-
129
-
130
-
131
-
132
-
133
-
134
-
135
-
136
-
137
-
138
-
139
-
140
-
141
-
142
-
143
-
144
-
145
-
146
-
147
-
148
-
149
-
150
-
151
-
152
-
153
-
154
-
155
-
156
-
157
-
158
-
159
-
160
-
161
-
162
-
163
-
164
-
165
-
166
-
167
-
168
-
169
-
170
-
171
-
172
-
173
-
174
-
175
-
176
-
177
-
178
-
179
-
180
-
181
-
182
-
183
-
184
-
185
-
186
-
187
-
188
-
 189
189 -
 190
190 -
 191
191 -
 192
192 -
 193
193 -
 194
194 -
 195
195 -
 196
196 -
 197
197 -
 198
198 -
 199
199 -
 200
200 -
 201
201 -
 202
202 -
 203
203 -
 204
204 -
 205
205 -
 206
206 -
 207
207 -
 208
208 -
 209
209 -
210
-
211
-
212
-
213
-
214
-
215
-
216
-
217
-
218
-
219
-
220
-
221
-
222
-
223
-
224
-
225
-
226
-
227
-
228
-
229
-
230
-
231
-
232
-
233
-
234
-
235
-
236
-
237
-
238
-
239
-
240
-
241
-
242
-
243
-
244
-
245
-
246
-
247
-
248
-
249
-
250
-
251
-
252
-
253
-
254
-
255
-
256
-
257
-
258
-
259
-
260
-
261
-
262
-
263
-
264
-
265
-
266
-
267
-
268
-
269
-
270
-
271
-
272
-
273
-
274
-
275
-
276
-
277
-
278
-
279
-
280
-
281
-
282
-
283
-
284
-
285
-
286
-
287
-
288
-
289
-
290
-
291
-
292
-
293
-
294
-
295
-
296
-
297
-
298
-
299
-
300
 |
 |

THE TRAVELERS COMPANIES, INC. AND SUBSIDIARIES
NOTES TO CONSOLIDATED FINANCIAL STATEMENTS (Continued)
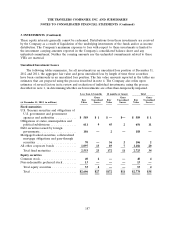
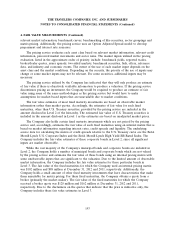
3. INVESTMENTS (Continued)
These equity interests generally cannot be redeemed. Distributions from these investments are received
by the Company as a result of liquidation of the underlying investments of the funds and/or as income
distribution. The Company’s maximum exposure to loss with respect to these investments is limited to
the investment carrying amounts reported in the Company’s consolidated balance sheet and any
unfunded commitment. Neither the carrying amounts nor the unfunded commitments related to these
VIEs are material.
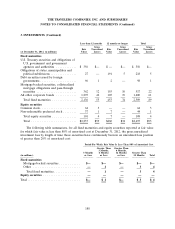
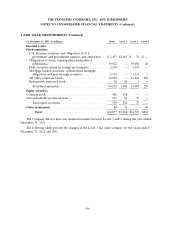
Unrealized Investment Losses
The following tables summarize, for all investments in an unrealized loss position at December 31,
2012 and 2011, the aggregate fair value and gross unrealized loss by length of time those securities
have been continuously in an unrealized loss position. The fair value amounts reported in the tables are
estimates that are prepared using the process described in note 4. The Company also relies upon
estimates of several factors in its review and evaluation of individual investments, using the process
described in note 1, in determining whether such investments are other-than-temporarily impaired.
Less than 12 months 12 months or longer Total
Gross Gross Gross
Fair Unrealized Fair Unrealized Fair Unrealized
(at December 31, 2012, in millions) Value Losses Value Losses Value Losses
Fixed maturities
U.S. Treasury securities and obligations of
U.S. government and government
agencies and authorities ............ $ 589 $ 1 $ — $— $ 589 $ 1
Obligations of states, municipalities and
political subdivisions ............... 611 9 45 2 656 11
Debt securities issued by foreign
governments ..................... 186 — 2 — 188 —
Mortgage-backed securities, collateralized
mortgage obligations and pass-through
securities ....................... 70 — 36 2 106 2
All other corporate bonds ............ 1,097 13 89 7 1,186 20
Total fixed maturities .............. 2,553 23 172 11 2,725 34
Equity securities
Common stock ..................... 404—— 404
Non-redeemable preferred stock ........ 13 — — — 13 —
Total equity securities .............. 534—— 534
Total .......................... $2,606 $27 $172 $11 $2,778 $38
187