Travelers 2012 Annual Report Download - page 210
Download and view the complete annual report
Please find page 210 of the 2012 Travelers annual report below. You can navigate through the pages in the report by either clicking on the pages listed below, or by using the keyword search tool below to find specific information within the annual report.-
 1
1 -
 2
2 -
 3
3 -
 4
4 -
 5
5 -
 6
6 -
 7
7 -
 8
8 -
 9
9 -
 10
10 -
 11
11 -
 12
12 -
 13
13 -
 14
14 -
 15
15 -
 16
16 -
 17
17 -
 18
18 -
 19
19 -
 20
20 -
 21
21 -
 22
22 -
 23
23 -
 24
24 -
 25
25 -
 26
26 -
 27
27 -
 28
28 -
 29
29 -
 30
30 -
 31
31 -
 32
32 -
 33
33 -
 34
34 -
 35
35 -
 36
36 -
 37
37 -
 38
38 -
 39
39 -
 40
40 -
 41
41 -
 42
42 -
 43
43 -
 44
44 -
 45
45 -
 46
46 -
 47
47 -
 48
48 -
 49
49 -
 50
50 -
 51
51 -
 52
52 -
 53
53 -
 54
54 -
 55
55 -
 56
56 -
 57
57 -
 58
58 -
 59
59 -
 60
60 -
 61
61 -
 62
62 -
 63
63 -
 64
64 -
 65
65 -
 66
66 -
 67
67 -
 68
68 -
 69
69 -
 70
70 -
 71
71 -
 72
72 -
 73
73 -
 74
74 -
 75
75 -
 76
76 -
 77
77 -
 78
78 -
 79
79 -
 80
80 -
 81
81 -
 82
82 -
 83
83 -
 84
84 -
 85
85 -
 86
86 -
 87
87 -
 88
88 -
 89
89 -
 90
90 -
 91
91 -
 92
92 -
 93
93 -
 94
94 -
 95
95 -
 96
96 -
 97
97 -
 98
98 -
 99
99 -
 100
100 -
 101
101 -
 102
102 -
 103
103 -
 104
104 -
 105
105 -
 106
106 -
 107
107 -
 108
108 -
 109
109 -
 110
110 -
 111
111 -
 112
112 -
 113
113 -
 114
114 -
 115
115 -
 116
116 -
 117
117 -
 118
118 -
 119
119 -
 120
120 -
 121
121 -
 122
122 -
 123
123 -
 124
124 -
 125
125 -
 126
126 -
 127
127 -
 128
128 -
 129
129 -
 130
130 -
 131
131 -
 132
132 -
 133
133 -
 134
134 -
 135
135 -
 136
136 -
 137
137 -
 138
138 -
 139
139 -
 140
140 -
 141
141 -
 142
142 -
 143
143 -
 144
144 -
 145
145 -
 146
146 -
 147
147 -
 148
148 -
 149
149 -
 150
150 -
 151
151 -
 152
152 -
 153
153 -
 154
154 -
 155
155 -
 156
156 -
 157
157 -
 158
158 -
 159
159 -
 160
160 -
 161
161 -
 162
162 -
 163
163 -
 164
164 -
 165
165 -
 166
166 -
 167
167 -
 168
168 -
 169
169 -
 170
170 -
 171
171 -
 172
172 -
 173
173 -
 174
174 -
 175
175 -
 176
176 -
 177
177 -
 178
178 -
 179
179 -
 180
180 -
 181
181 -
 182
182 -
 183
183 -
 184
184 -
 185
185 -
 186
186 -
 187
187 -
 188
188 -
 189
189 -
 190
190 -
 191
191 -
 192
192 -
 193
193 -
 194
194 -
 195
195 -
 196
196 -
 197
197 -
 198
198 -
 199
199 -
 200
200 -
 201
201 -
 202
202 -
 203
203 -
 204
204 -
 205
205 -
 206
206 -
 207
207 -
 208
208 -
 209
209 -
 210
210 -
 211
211 -
 212
212 -
 213
213 -
 214
214 -
 215
215 -
 216
216 -
 217
217 -
 218
218 -
 219
219 -
 220
220 -
 221
221 -
 222
222 -
 223
223 -
 224
224 -
 225
225 -
 226
226 -
 227
227 -
 228
228 -
 229
229 -
 230
230 -
 231
231 -
 232
232 -
 233
233 -
 234
234 -
 235
235 -
 236
236 -
 237
237 -
 238
238 -
 239
239 -
 240
240 -
 241
241 -
 242
242 -
 243
243 -
 244
244 -
 245
245 -
 246
246 -
 247
247 -
 248
248 -
 249
249 -
 250
250 -
 251
251 -
 252
252 -
 253
253 -
 254
254 -
 255
255 -
 256
256 -
 257
257 -
 258
258 -
 259
259 -
 260
260 -
 261
261 -
 262
262 -
 263
263 -
 264
264 -
 265
265 -
 266
266 -
 267
267 -
 268
268 -
 269
269 -
 270
270 -
 271
271 -
 272
272 -
 273
273 -
 274
274 -
 275
275 -
 276
276 -
 277
277 -
 278
278 -
 279
279 -
 280
280 -
 281
281 -
 282
282 -
 283
283 -
 284
284 -
 285
285 -
 286
286 -
 287
287 -
 288
288 -
 289
289 -
 290
290 -
 291
291 -
 292
292 -
 293
293 -
 294
294 -
 295
295 -
 296
296 -
 297
297 -
 298
298 -
 299
299 -
 300
300
 |
 |

THE TRAVELERS COMPANIES, INC. AND SUBSIDIARIES
NOTES TO CONSOLIDATED FINANCIAL STATEMENTS (Continued)
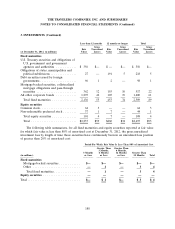
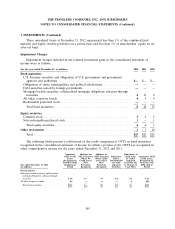
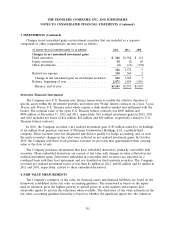
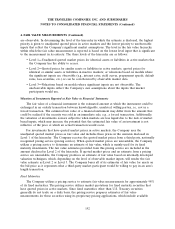
4. FAIR VALUE MEASUREMENTS (Continued)
The Company had no material assets or liabilities that were measured at fair value on a
non-recurring basis during the years ended December 31, 2012 and 2011.
Financial Instruments Disclosed, But Not Carried, At Fair Value
The Company uses various financial instruments in the normal course of its business. The
Company’s insurance contracts are excluded from fair value of financial instruments accounting
guidance and, therefore, are not included in the amounts discussed below. The following tables present
the carrying value and fair value of the Company’s financial assets and financial liabilities disclosed, but
not carried, at fair value at December 31, 2012 and 2011, and the level within the fair value hierarchy
at which such assets and liabilities are measured on a recurring basis.
Carrying Fair
(at December 31, 2012, in millions) Value Value Level 1 Level 2 Level 3
Financial assets:
Short-term securities .............. $3,483 $3,483 $1,448 $1,957 $78
Financial liabilities:
Debt .......................... $6,250 $7,715 $ — $7,715 $—
Commercial paper ................ $ 100 $ 100 — $ 100 —
Carrying Fair
(at December 31, 2011, in millions) Value Value Level 1 Level 2 Level 3
Financial assets:
Short-term securities .............. $3,594 $3,594 $2,472 $1,029 $93
Financial liabilities:
Debt .......................... $6,505 $7,583 $ — $7,583 $—
Commercial paper ................ $ 100 $ 100 — $ 100 —
The Company utilized a pricing service to estimate fair value for approximately 95% and 94% of
short-term securities at December 31, 2012 and 2011, respectively. A description of the process and
inputs used by the pricing service to estimate fair value is discussed in the ‘‘Fixed Maturities’’ section
above. Estimates of fair value for U.S. Treasury securities and money market funds are based on
market quotations received from the pricing service and are disclosed in Level 1 of the hierarchy. The
fair value of other short-term fixed maturity securities is estimated by the pricing service using
observable market inputs and is disclosed in Level 2 of the hierarchy. For short-term securities where
an estimate is not obtained from the pricing service, the carrying value approximates fair value and is
included in Level 3 of the hierarchy.
The Company utilized a pricing service to estimate fair value for 100% of its debt, including
commercial paper, at both December 31, 2012 and 2011. The pricing service utilizes market quotations
for debt that have quoted prices in active markets. Since fixed maturities other than U.S. Treasury
securities generally do not trade on a daily basis, the fair value estimates are based on market
observable inputs and disclosed at Level 2 in the hierarchy. For the small amount of the Company’s
debt securities for which a pricing service is not used, the Company utilizes pricing estimates from a
nationally recognized broker/dealer to estimate fair value. If estimates of fair value are unavailable
from the pricing service or the broker/dealer, the Company produces an estimate of fair value based on
198
