Travelers 2012 Annual Report Download - page 103
Download and view the complete annual report
Please find page 103 of the 2012 Travelers annual report below. You can navigate through the pages in the report by either clicking on the pages listed below, or by using the keyword search tool below to find specific information within the annual report.-
 1
1 -
2
-
3
-
4
-
5
-
6
-
7
-
8
-
9
-
10
-
11
-
12
-
13
-
14
-
15
-
16
-
17
-
18
-
19
-
20
-
21
-
22
-
23
-
24
-
25
-
26
-
27
-
28
-
29
-
30
-
31
-
32
-
33
-
34
-
35
-
36
-
37
-
38
-
39
-
40
-
41
-
42
-
43
-
44
-
45
-
46
-
47
-
48
-
49
-
50
-
51
-
52
-
53
-
54
-
55
-
56
-
57
-
58
-
59
-
60
-
61
-
62
-
63
-
64
-
65
-
66
-
67
-
68
-
69
-
70
-
71
-
72
-
73
-
74
-
75
-
76
-
77
-
78
-
79
-
80
-
81
-
82
-
83
-
84
-
85
-
86
-
87
-
88
-
89
-
90
-
91
-
92
-
 93
93 -
 94
94 -
 95
95 -
 96
96 -
 97
97 -
 98
98 -
 99
99 -
 100
100 -
 101
101 -
 102
102 -
 103
103 -
 104
104 -
 105
105 -
 106
106 -
 107
107 -
 108
108 -
 109
109 -
 110
110 -
 111
111 -
 112
112 -
 113
113 -
114
-
115
-
116
-
117
-
118
-
119
-
120
-
121
-
122
-
123
-
124
-
125
-
126
-
127
-
128
-
129
-
130
-
131
-
132
-
133
-
134
-
135
-
136
-
137
-
138
-
139
-
140
-
141
-
142
-
143
-
144
-
145
-
146
-
147
-
148
-
149
-
150
-
151
-
152
-
153
-
154
-
155
-
156
-
157
-
158
-
159
-
160
-
161
-
162
-
163
-
164
-
165
-
166
-
167
-
168
-
169
-
170
-
171
-
172
-
173
-
174
-
175
-
176
-
177
-
178
-
179
-
180
-
181
-
182
-
183
-
184
-
185
-
186
-
187
-
188
-
189
-
190
-
191
-
192
-
193
-
194
-
195
-
196
-
197
-
198
-
199
-
200
-
201
-
202
-
203
-
204
-
205
-
206
-
207
-
208
-
209
-
210
-
211
-
212
-
213
-
214
-
215
-
216
-
217
-
218
-
219
-
220
-
221
-
222
-
223
-
224
-
225
-
226
-
227
-
228
-
229
-
230
-
231
-
232
-
233
-
234
-
235
-
236
-
237
-
238
-
239
-
240
-
241
-
242
-
243
-
244
-
245
-
246
-
247
-
248
-
249
-
250
-
251
-
252
-
253
-
254
-
255
-
256
-
257
-
258
-
259
-
260
-
261
-
262
-
263
-
264
-
265
-
266
-
267
-
268
-
269
-
270
-
271
-
272
-
273
-
274
-
275
-
276
-
277
-
278
-
279
-
280
-
281
-
282
-
283
-
284
-
285
-
286
-
287
-
288
-
289
-
290
-
291
-
292
-
293
-
294
-
295
-
296
-
297
-
298
-
299
-
300
 |
 |
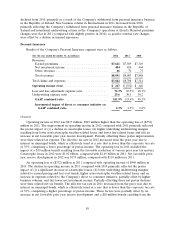
‘‘amortization of deferred acquisition costs’’), and growth in the Company’s direct to consumer business
(for which no commission expense is incurred).
General and Administrative Expenses
General and administrative expenses in 2012 were $900 million, $8 million or 1% lower than in
2011. General and administrative expenses in 2011 were $908 million, $41 million or 5% higher than in
2010. The increase in 2011 was primarily driven by costs associated with the Company’s direct to
consumer initiative, as well as the increase in contingent commission expense due to the increase in the
number of agents reverting to a contingent commission compensation program. The cost of the
contingent commission program is not subject to deferred acquisition cost accounting treatment and,
therefore, is expensed as incurred.
Income Tax Expense
Income tax expense in 2012 was $32 million, compared to an income tax benefit of $293 million in
2011. The change in income tax expense of $325 million in 2012 from 2011 primarily reflected the $898
million decrease in underwriting loss (including the favorable impacts of a decrease in catastrophes and
an increase in net favorable prior year reserve development) from 2011. The change in income tax
expense in 2012 from 2011 was also impacted by the $10 million benefit in 2011 resulting from the
favorable resolution of various prior year tax matters.
The income tax benefit in 2011 was $293 million, compared to income tax expense of $134 million
in 2010. The change in income tax expense (benefit) of ($427) million in 2011 from 2010 primarily
reflected the $1.15 billion decrease in underwriting margins (including the unfavorable impacts of an
increase in catastrophes and a decline in net favorable prior year reserve development) from 2011. The
change in income tax expense (benefit) was also impacted by the $10 million benefit in 2011 resulting
from the favorable resolution of various prior year tax matters.
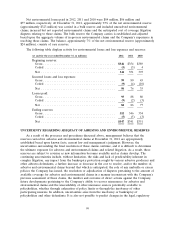
GAAP Combined Ratio
The GAAP combined ratio of 101.9% in 2012 was 11.7 points lower than the GAAP combined
ratio of 113.6% in 2011.
The loss and loss adjustment expense ratio of 72.3% in 2012 was 11.2 points lower than the loss
and loss adjustment expense ratio of 83.5% in 2011. Catastrophe losses accounted for 13.4 points and
19.6 points of the loss and loss adjustment expense ratios in 2012 and 2011, respectively. The loss and
loss adjustment expense ratio for 2012 and 2011 included 2.3 points and 1.5 points of benefit,
respectively, from net favorable prior year reserve development. The 2012 underlying loss and loss
adjustment expense ratio was 4.2 points lower than the 2011 ratio on the same basis, reflecting the
factors discussed above.
The underwriting expense ratio of 29.6% in 2012 was 0.5 points lower than the underwriting
expense ratio of 30.1% in 2011.
The GAAP combined ratio of 113.6% in 2011 was 15.3 points higher than the GAAP combined
ratio of 98.3% in 2010.
The loss and loss adjustment expense ratio of 83.5% in 2011 was 15.4 points higher than the 2010
ratio of 68.1%. Catastrophe losses accounted for 19.6 and 8.1 points of the loss and loss adjustment
expense ratio in 2011 and 2010, respectively. Net favorable prior year reserve development provided 1.5
points and 1.2 points of benefit to the loss and loss adjustment expense ratio in 2011 and 2010,
respectively. The 2011 underlying loss and loss adjustment expense ratio was 4.2 points higher than the
2010 ratio on the same basis, reflecting the factors discussed above.
91