Travelers 2012 Annual Report Download - page 90
Download and view the complete annual report
Please find page 90 of the 2012 Travelers annual report below. You can navigate through the pages in the report by either clicking on the pages listed below, or by using the keyword search tool below to find specific information within the annual report.-
 1
1 -
2
-
3
-
4
-
5
-
6
-
7
-
8
-
9
-
10
-
11
-
12
-
13
-
14
-
15
-
16
-
17
-
18
-
19
-
20
-
21
-
22
-
23
-
24
-
25
-
26
-
27
-
28
-
29
-
30
-
31
-
32
-
33
-
34
-
35
-
36
-
37
-
38
-
39
-
40
-
41
-
42
-
43
-
44
-
45
-
46
-
47
-
48
-
49
-
50
-
51
-
52
-
53
-
54
-
55
-
56
-
57
-
58
-
59
-
60
-
61
-
62
-
63
-
64
-
65
-
66
-
67
-
68
-
69
-
70
-
71
-
72
-
73
-
74
-
75
-
76
-
77
-
78
-
79
-
 80
80 -
 81
81 -
 82
82 -
 83
83 -
 84
84 -
 85
85 -
 86
86 -
 87
87 -
 88
88 -
 89
89 -
 90
90 -
 91
91 -
 92
92 -
 93
93 -
 94
94 -
 95
95 -
 96
96 -
 97
97 -
 98
98 -
 99
99 -
 100
100 -
101
-
102
-
103
-
104
-
105
-
106
-
107
-
108
-
109
-
110
-
111
-
112
-
113
-
114
-
115
-
116
-
117
-
118
-
119
-
120
-
121
-
122
-
123
-
124
-
125
-
126
-
127
-
128
-
129
-
130
-
131
-
132
-
133
-
134
-
135
-
136
-
137
-
138
-
139
-
140
-
141
-
142
-
143
-
144
-
145
-
146
-
147
-
148
-
149
-
150
-
151
-
152
-
153
-
154
-
155
-
156
-
157
-
158
-
159
-
160
-
161
-
162
-
163
-
164
-
165
-
166
-
167
-
168
-
169
-
170
-
171
-
172
-
173
-
174
-
175
-
176
-
177
-
178
-
179
-
180
-
181
-
182
-
183
-
184
-
185
-
186
-
187
-
188
-
189
-
190
-
191
-
192
-
193
-
194
-
195
-
196
-
197
-
198
-
199
-
200
-
201
-
202
-
203
-
204
-
205
-
206
-
207
-
208
-
209
-
210
-
211
-
212
-
213
-
214
-
215
-
216
-
217
-
218
-
219
-
220
-
221
-
222
-
223
-
224
-
225
-
226
-
227
-
228
-
229
-
230
-
231
-
232
-
233
-
234
-
235
-
236
-
237
-
238
-
239
-
240
-
241
-
242
-
243
-
244
-
245
-
246
-
247
-
248
-
249
-
250
-
251
-
252
-
253
-
254
-
255
-
256
-
257
-
258
-
259
-
260
-
261
-
262
-
263
-
264
-
265
-
266
-
267
-
268
-
269
-
270
-
271
-
272
-
273
-
274
-
275
-
276
-
277
-
278
-
279
-
280
-
281
-
282
-
283
-
284
-
285
-
286
-
287
-
288
-
289
-
290
-
291
-
292
-
293
-
294
-
295
-
296
-
297
-
298
-
299
-
300
 |
 |
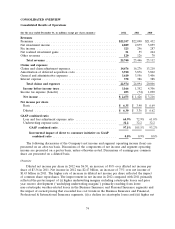
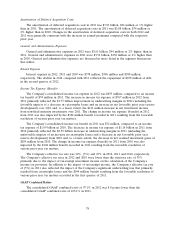
Amortization of Deferred Acquisition Costs
The amortization of deferred acquisition costs in 2012 was $3.91 billion, $34 million or 1% higher
than in 2011. The amortization of deferred acquisition costs in 2011 was $3.88 billion, $74 million or
2% higher than in 2010. Changes in the amortization of deferred acquisition costs in both 2012 and
2011 were generally consistent with the increase in earned premiums compared with the respective
prior year.
General and Administrative Expenses
General and administrative expenses in 2012 were $3.61 billion, $54 million or 2% higher than in
2011. General and administrative expenses in 2011 were $3.56 billion, $150 million or 4% higher than
in 2010. General and administrative expenses are discussed in more detail in the segment discussions
that follow.
Interest Expense
Interest expense in 2012, 2011 and 2010 was $378 million, $386 million and $388 million,
respectively. The decline in 2012 compared with 2011 reflected the repayment of $258 million of debt
in the second quarter of 2012.
Income Tax Expense (Benefit)
The Company’s consolidated income tax expense in 2012 was $693 million, compared to an income
tax benefit of $74 million in 2011. The increase in income tax expense of $767 million in 2012 from
2011 primarily reflected the $1.77 billion improvement in underwriting margins in 2012 (including the
favorable impacts of a decrease in catastrophe losses and an increase in net favorable prior year reserve
development) over 2011 and, to a lesser extent, the $121 million increase in net investment income
from non-fixed maturity investments over 2011. The change in income tax expense (benefit) in 2012
from 2011 was also impacted by the $104 million benefit recorded in 2011 resulting from the favorable
resolution of various prior year tax matters.
The Company’s consolidated income tax benefit in 2011 was $74 million, compared to an income
tax expense of $1.09 billion in 2010. The decrease in income tax expense of $1.16 billion in 2011 from
2010 primarily reflected the $2.59 billion decrease in underwriting margins in 2011 (including the
unfavorable impacts of an increase in catastrophe losses and a decrease in net favorable prior year
reserve development) from 2010 and, to a lesser extent, the decrease in net realized investment gains of
$209 million from 2010. The change in income tax expense (benefit) in 2011 from 2010 was also
impacted by the $104 million benefit recorded in 2011 resulting from the favorable resolution of
various prior year tax matters.
The Company’s effective tax rate was 22%, (5%) and 25% in 2012, 2011 and 2010, respectively.
The Company’s effective tax rates in 2012 and 2010 were lower than the statutory rate of 35%
primarily due to the impact of tax-exempt investment income on the calculation of the Company’s
income tax provision. In addition to the impact of tax-exempt income, the Company’s effective tax rate
of (5%) in 2011 also reflected the impact of the Company’s significant underwriting loss that primarily
resulted from catastrophe losses and the $104 million benefit resulting from the favorable resolution of
various prior year tax matters recorded in the first quarter of 2011.
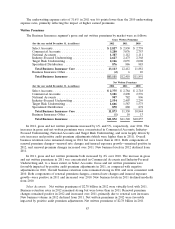
GAAP Combined Ratios
The consolidated GAAP combined ratio of 97.1% in 2012 was 8.0 points lower than the
consolidated GAAP combined ratio of 105.1% in 2011.
78