Travelers 2012 Annual Report Download - page 100
Download and view the complete annual report
Please find page 100 of the 2012 Travelers annual report below. You can navigate through the pages in the report by either clicking on the pages listed below, or by using the keyword search tool below to find specific information within the annual report.-
 1
1 -
2
-
3
-
4
-
5
-
6
-
7
-
8
-
9
-
10
-
11
-
12
-
13
-
14
-
15
-
16
-
17
-
18
-
19
-
20
-
21
-
22
-
23
-
24
-
25
-
26
-
27
-
28
-
29
-
30
-
31
-
32
-
33
-
34
-
35
-
36
-
37
-
38
-
39
-
40
-
41
-
42
-
43
-
44
-
45
-
46
-
47
-
48
-
49
-
50
-
51
-
52
-
53
-
54
-
55
-
56
-
57
-
58
-
59
-
60
-
61
-
62
-
63
-
64
-
65
-
66
-
67
-
68
-
69
-
70
-
71
-
72
-
73
-
74
-
75
-
76
-
77
-
78
-
79
-
80
-
81
-
82
-
83
-
84
-
85
-
86
-
87
-
88
-
89
-
 90
90 -
 91
91 -
 92
92 -
 93
93 -
 94
94 -
 95
95 -
 96
96 -
 97
97 -
 98
98 -
 99
99 -
 100
100 -
 101
101 -
 102
102 -
 103
103 -
 104
104 -
 105
105 -
 106
106 -
 107
107 -
 108
108 -
 109
109 -
 110
110 -
111
-
112
-
113
-
114
-
115
-
116
-
117
-
118
-
119
-
120
-
121
-
122
-
123
-
124
-
125
-
126
-
127
-
128
-
129
-
130
-
131
-
132
-
133
-
134
-
135
-
136
-
137
-
138
-
139
-
140
-
141
-
142
-
143
-
144
-
145
-
146
-
147
-
148
-
149
-
150
-
151
-
152
-
153
-
154
-
155
-
156
-
157
-
158
-
159
-
160
-
161
-
162
-
163
-
164
-
165
-
166
-
167
-
168
-
169
-
170
-
171
-
172
-
173
-
174
-
175
-
176
-
177
-
178
-
179
-
180
-
181
-
182
-
183
-
184
-
185
-
186
-
187
-
188
-
189
-
190
-
191
-
192
-
193
-
194
-
195
-
196
-
197
-
198
-
199
-
200
-
201
-
202
-
203
-
204
-
205
-
206
-
207
-
208
-
209
-
210
-
211
-
212
-
213
-
214
-
215
-
216
-
217
-
218
-
219
-
220
-
221
-
222
-
223
-
224
-
225
-
226
-
227
-
228
-
229
-
230
-
231
-
232
-
233
-
234
-
235
-
236
-
237
-
238
-
239
-
240
-
241
-
242
-
243
-
244
-
245
-
246
-
247
-
248
-
249
-
250
-
251
-
252
-
253
-
254
-
255
-
256
-
257
-
258
-
259
-
260
-
261
-
262
-
263
-
264
-
265
-
266
-
267
-
268
-
269
-
270
-
271
-
272
-
273
-
274
-
275
-
276
-
277
-
278
-
279
-
280
-
281
-
282
-
283
-
284
-
285
-
286
-
287
-
288
-
289
-
290
-
291
-
292
-
293
-
294
-
295
-
296
-
297
-
298
-
299
-
300
 |
 |

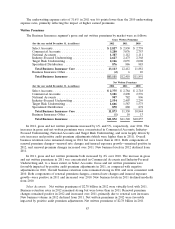
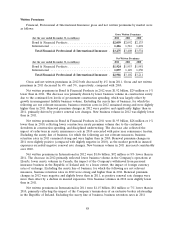
Written Premiums
Financial, Professional & International Insurance gross and net written premiums by market were
as follows:
Gross Written Premiums
(for the year ended December 31, in millions) 2012 2011 2010
Bond & Financial Products ........................ $2,059 $2,092 $2,133
International .................................. 1,216 1,316 1,401
Total Financial, Professional & International Insurance .$3,275 $3,408 $3,534
Net Written Premiums
(for the year ended December 31, in millions) 2012 2011 2010
Bond & Financial Products ........................ $1,924 $1,953 $1,981
International .................................. 1,057 1,149 1,230
Total Financial, Professional & International Insurance .$2,981 $3,102 $3,211
Gross and net written premiums in 2012 both decreased by 4% from 2011. Gross and net written
premiums in 2011 decreased by 4% and 3%, respectively, compared with 2010.
Net written premiums in Bond & Financial Products in 2012 were $1.92 billion, $29 million or 1%
lower than in 2011. The decrease was primarily driven by lower business volume in construction surety
due to the continued low levels of government construction spending, which was largely offset by
growth in management liability business volume. Excluding the surety line of business, for which the
following are not relevant measures, business retention rates in 2012 remained strong and were slightly
higher than in 2011. Renewal premium changes in 2012 were positive and significantly higher than in
2011, primarily driven by positive renewal rate changes. New business volume in 2012 was slightly lower
than in 2011.
Net written premiums in Bond & Financial Products in 2011 were $1.95 billion, $28 million or 1%
lower than in 2010, reflecting lower construction surety premium volume due to the continued
slowdown in construction spending, and disciplined underwriting. The decrease also reflected the
impact of reductions in surety reinsurance costs in 2010 associated with prior year reinsurance treaties.
Excluding the surety line of business, for which the following are not relevant measures, business
retention rates in 2011 remained strong and were higher than in 2010. Renewal premium changes in
2011 were slightly positive (compared with slightly negative in 2010), as the modest growth in insured
exposures exceeded negative renewal rate changes. New business volume in 2011 increased considerably
over 2010.
Net written premiums in International in 2012 were $1.06 billion, $92 million or 8% lower than in
2011. The decrease in 2012 primarily reflected lower business volume in the Company’s operations at
Lloyd’s, lower surety volumes in Canada, the impact of the Company’s withdrawal from personal
insurance business in the Republic of Ireland and, to a lesser extent, the impact of foreign currency
rates of exchange. Excluding the surety line of business, for which the following are not relevant
measures, business retention rates in 2012 were strong and higher than in 2011. Renewal premium
changes in 2012 were negative and slightly lower than in 2011, as positive renewal rate changes were
more than offset by a decline in insured exposures. New business volumes in 2012 were slightly lower
than in 2011.
Net written premiums in International in 2011 were $1.15 billion, $81 million or 7% lower than in
2010, primarily reflecting the impact of the Company’s termination of an exclusive broker relationship
in the Republic of Ireland. Excluding the surety line of business, business retention rates in 2011
88