Travelers 2012 Annual Report Download - page 243
Download and view the complete annual report
Please find page 243 of the 2012 Travelers annual report below. You can navigate through the pages in the report by either clicking on the pages listed below, or by using the keyword search tool below to find specific information within the annual report.-
 1
1 -
 2
2 -
 3
3 -
 4
4 -
 5
5 -
 6
6 -
 7
7 -
 8
8 -
 9
9 -
 10
10 -
 11
11 -
 12
12 -
 13
13 -
 14
14 -
 15
15 -
 16
16 -
 17
17 -
 18
18 -
 19
19 -
 20
20 -
 21
21 -
 22
22 -
 23
23 -
 24
24 -
 25
25 -
 26
26 -
 27
27 -
 28
28 -
 29
29 -
 30
30 -
 31
31 -
 32
32 -
 33
33 -
 34
34 -
 35
35 -
 36
36 -
 37
37 -
 38
38 -
 39
39 -
 40
40 -
 41
41 -
 42
42 -
 43
43 -
 44
44 -
 45
45 -
 46
46 -
 47
47 -
 48
48 -
 49
49 -
 50
50 -
 51
51 -
 52
52 -
 53
53 -
 54
54 -
 55
55 -
 56
56 -
 57
57 -
 58
58 -
 59
59 -
 60
60 -
 61
61 -
 62
62 -
 63
63 -
 64
64 -
 65
65 -
 66
66 -
 67
67 -
 68
68 -
 69
69 -
 70
70 -
 71
71 -
 72
72 -
 73
73 -
 74
74 -
 75
75 -
 76
76 -
 77
77 -
 78
78 -
 79
79 -
 80
80 -
 81
81 -
 82
82 -
 83
83 -
 84
84 -
 85
85 -
 86
86 -
 87
87 -
 88
88 -
 89
89 -
 90
90 -
 91
91 -
 92
92 -
 93
93 -
 94
94 -
 95
95 -
 96
96 -
 97
97 -
 98
98 -
 99
99 -
 100
100 -
 101
101 -
 102
102 -
 103
103 -
 104
104 -
 105
105 -
 106
106 -
 107
107 -
 108
108 -
 109
109 -
 110
110 -
 111
111 -
 112
112 -
 113
113 -
 114
114 -
 115
115 -
 116
116 -
 117
117 -
 118
118 -
 119
119 -
 120
120 -
 121
121 -
 122
122 -
 123
123 -
 124
124 -
 125
125 -
 126
126 -
 127
127 -
 128
128 -
 129
129 -
 130
130 -
 131
131 -
 132
132 -
 133
133 -
 134
134 -
 135
135 -
 136
136 -
 137
137 -
 138
138 -
 139
139 -
 140
140 -
 141
141 -
 142
142 -
 143
143 -
 144
144 -
 145
145 -
 146
146 -
 147
147 -
 148
148 -
 149
149 -
 150
150 -
 151
151 -
 152
152 -
 153
153 -
 154
154 -
 155
155 -
 156
156 -
 157
157 -
 158
158 -
 159
159 -
 160
160 -
 161
161 -
 162
162 -
 163
163 -
 164
164 -
 165
165 -
 166
166 -
 167
167 -
 168
168 -
 169
169 -
 170
170 -
 171
171 -
 172
172 -
 173
173 -
 174
174 -
 175
175 -
 176
176 -
 177
177 -
 178
178 -
 179
179 -
 180
180 -
 181
181 -
 182
182 -
 183
183 -
 184
184 -
 185
185 -
 186
186 -
 187
187 -
 188
188 -
 189
189 -
 190
190 -
 191
191 -
 192
192 -
 193
193 -
 194
194 -
 195
195 -
 196
196 -
 197
197 -
 198
198 -
 199
199 -
 200
200 -
 201
201 -
 202
202 -
 203
203 -
 204
204 -
 205
205 -
 206
206 -
 207
207 -
 208
208 -
 209
209 -
 210
210 -
 211
211 -
 212
212 -
 213
213 -
 214
214 -
 215
215 -
 216
216 -
 217
217 -
 218
218 -
 219
219 -
 220
220 -
 221
221 -
 222
222 -
 223
223 -
 224
224 -
 225
225 -
 226
226 -
 227
227 -
 228
228 -
 229
229 -
 230
230 -
 231
231 -
 232
232 -
 233
233 -
 234
234 -
 235
235 -
 236
236 -
 237
237 -
 238
238 -
 239
239 -
 240
240 -
 241
241 -
 242
242 -
 243
243 -
 244
244 -
 245
245 -
 246
246 -
 247
247 -
 248
248 -
 249
249 -
 250
250 -
 251
251 -
 252
252 -
 253
253 -
 254
254 -
 255
255 -
 256
256 -
 257
257 -
 258
258 -
 259
259 -
 260
260 -
 261
261 -
 262
262 -
 263
263 -
 264
264 -
 265
265 -
 266
266 -
 267
267 -
 268
268 -
 269
269 -
 270
270 -
 271
271 -
 272
272 -
 273
273 -
 274
274 -
 275
275 -
 276
276 -
 277
277 -
 278
278 -
 279
279 -
 280
280 -
 281
281 -
 282
282 -
 283
283 -
 284
284 -
 285
285 -
 286
286 -
 287
287 -
 288
288 -
 289
289 -
 290
290 -
 291
291 -
 292
292 -
 293
293 -
 294
294 -
 295
295 -
 296
296 -
 297
297 -
 298
298 -
 299
299 -
 300
300
 |
 |

THE TRAVELERS COMPANIES, INC. AND SUBSIDIARIES
NOTES TO CONSOLIDATED FINANCIAL STATEMENTS (Continued)
14. PENSION PLANS, RETIREMENT BENEFITS AND SAVINGS PLANS (Continued)
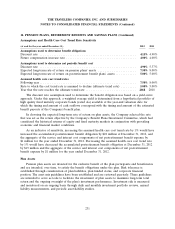
Assumptions and Health Care Cost Trend Rate Sensitivity
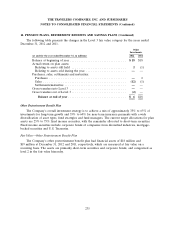
(at and for the year ended December 31,) 2012 2011
Assumptions used to determine benefit obligations
Discount rate ....................................................... 4.15% 4.90%
Future compensation increase rate ........................................ 4.00% 4.00%
Assumptions used to determine net periodic benefit cost
Discount rate ....................................................... 4.90% 5.37%
Expected long-term rate of return on pension plans’ assets ...................... 7.50% 8.00%
Expected long-term rate of return on postretirement benefit plans’ assets ............ 5.00% 5.00%
Assumed health care cost trend rates
Following year ....................................................... 7.50% 8.00%
Rate to which the cost trend rate is assumed to decline (ultimate trend rate) ......... 5.00% 5.00%
Year that the rate reaches the ultimate trend rate ............................. 2018 2018
The discount rate assumption used to determine the benefit obligation was based on a yield-curve
approach. Under this approach, a weighted average yield is determined from a hypothetical portfolio of
high quality fixed maturity corporate bonds (rated Aa) available at the year-end valuation date for
which the timing and amount of cash outflows correspond with the timing and amount of the estimated
benefit payouts of the Company’s benefit plan.
In choosing the expected long-term rate of return on plan assets, the Company selected the rate
that was set as the return objective by the Company’s Benefit Plans Investment Committee, which had
considered the historical returns of equity and fixed maturity markets in conjunction with prevailing
economic and financial market conditions.
As an indicator of sensitivity, increasing the assumed health care cost trend rate by 1% would have
increased the accumulated postretirement benefit obligation by $22 million at December 31, 2012, and
the aggregate of the service and interest cost components of net postretirement benefit expense by
$1 million for the year ended December 31, 2012. Decreasing the assumed health care cost trend rate
by 1% would have decreased the accumulated postretirement benefit obligation at December 31, 2012
by $19 million and the aggregate of the service and interest cost components of net postretirement
benefit expense by $1 million for the year ended December 31, 2012.
Plan Assets
Pension plan assets are invested for the exclusive benefit of the plan participants and beneficiaries
and are intended, over time, to satisfy the benefit obligations under the plan. Risk tolerance is
established through consideration of plan liabilities, plan funded status, and corporate financial
position. The asset mix guidelines have been established and are reviewed quarterly. These guidelines
are intended to serve as tools to facilitate the investment of plan assets to maximize long-term total
return and the ongoing oversight of the plan’s investment performance. Investment risk is measured
and monitored on an ongoing basis through daily and monthly investment portfolio reviews, annual
liability measurements, and periodic asset/liability studies.
231
