Travelers 2012 Annual Report Download - page 200
Download and view the complete annual report
Please find page 200 of the 2012 Travelers annual report below. You can navigate through the pages in the report by either clicking on the pages listed below, or by using the keyword search tool below to find specific information within the annual report.-
 1
1 -
2
-
3
-
4
-
5
-
6
-
7
-
8
-
9
-
10
-
11
-
12
-
13
-
14
-
15
-
16
-
17
-
18
-
19
-
20
-
21
-
22
-
23
-
24
-
25
-
26
-
27
-
28
-
29
-
30
-
31
-
32
-
33
-
34
-
35
-
36
-
37
-
38
-
39
-
40
-
41
-
42
-
43
-
44
-
45
-
46
-
47
-
48
-
49
-
50
-
51
-
52
-
53
-
54
-
55
-
56
-
57
-
58
-
59
-
60
-
61
-
62
-
63
-
64
-
65
-
66
-
67
-
68
-
69
-
70
-
71
-
72
-
73
-
74
-
75
-
76
-
77
-
78
-
79
-
80
-
81
-
82
-
83
-
84
-
85
-
86
-
87
-
88
-
89
-
90
-
91
-
92
-
93
-
94
-
95
-
96
-
97
-
98
-
99
-
100
-
101
-
102
-
103
-
104
-
105
-
106
-
107
-
108
-
109
-
110
-
111
-
112
-
113
-
114
-
115
-
116
-
117
-
118
-
119
-
120
-
121
-
122
-
123
-
124
-
125
-
126
-
127
-
128
-
129
-
130
-
131
-
132
-
133
-
134
-
135
-
136
-
137
-
138
-
139
-
140
-
141
-
142
-
143
-
144
-
145
-
146
-
147
-
148
-
149
-
150
-
151
-
152
-
153
-
154
-
155
-
156
-
157
-
158
-
159
-
160
-
161
-
162
-
163
-
164
-
165
-
166
-
167
-
168
-
169
-
170
-
171
-
172
-
173
-
174
-
175
-
176
-
177
-
178
-
179
-
180
-
181
-
182
-
183
-
184
-
185
-
186
-
187
-
188
-
189
-
 190
190 -
 191
191 -
 192
192 -
 193
193 -
 194
194 -
 195
195 -
 196
196 -
 197
197 -
 198
198 -
 199
199 -
 200
200 -
 201
201 -
 202
202 -
 203
203 -
 204
204 -
 205
205 -
 206
206 -
 207
207 -
 208
208 -
 209
209 -
 210
210 -
211
-
212
-
213
-
214
-
215
-
216
-
217
-
218
-
219
-
220
-
221
-
222
-
223
-
224
-
225
-
226
-
227
-
228
-
229
-
230
-
231
-
232
-
233
-
234
-
235
-
236
-
237
-
238
-
239
-
240
-
241
-
242
-
243
-
244
-
245
-
246
-
247
-
248
-
249
-
250
-
251
-
252
-
253
-
254
-
255
-
256
-
257
-
258
-
259
-
260
-
261
-
262
-
263
-
264
-
265
-
266
-
267
-
268
-
269
-
270
-
271
-
272
-
273
-
274
-
275
-
276
-
277
-
278
-
279
-
280
-
281
-
282
-
283
-
284
-
285
-
286
-
287
-
288
-
289
-
290
-
291
-
292
-
293
-
294
-
295
-
296
-
297
-
298
-
299
-
300
 |
 |

THE TRAVELERS COMPANIES, INC. AND SUBSIDIARIES
NOTES TO CONSOLIDATED FINANCIAL STATEMENTS (Continued)
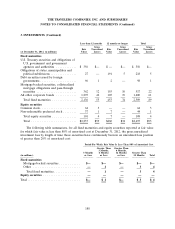
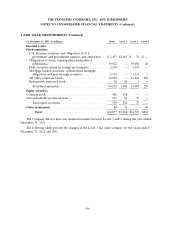
3. INVESTMENTS (Continued)
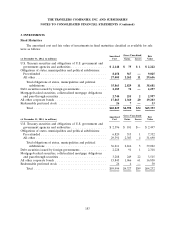
Less than 12 months 12 months or longer Total
Gross Gross Gross
Fair Unrealized Fair Unrealized Fair Unrealized
(at December 31, 2011, in millions) Value Losses Value Losses Value Losses
Fixed maturities
U.S. Treasury securities and obligations of
U.S. government and government
agencies and authorities ............ $ 356 $— $ — $— $ 356 $—
Obligations of states, municipalities and
political subdivisions ............... 27 — 191 5 218 5
Debt securities issued by foreign
governments ..................... 96 1 2 — 98 1
Mortgage-backed securities, collateralized
mortgage obligations and pass-through
securities ....................... 362 12 155 10 517 22
All other corporate bonds ............ 1,295 42 105 19 1,400 61
Total fixed maturities .............. 2,136 55 453 34 2,589 89
Equity securities
Common stock ..................... 64 3 — — 64 3
Non-redeemable preferred stock ........ 37 1 7 — 44 1
Total equity securities .............. 101 4 7 — 108 4
Total .......................... $2,237 $59 $460 $34 $2,697 $93
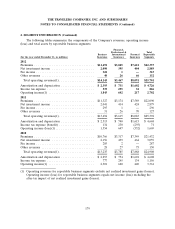
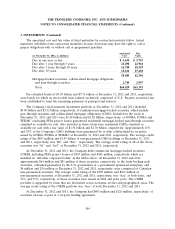
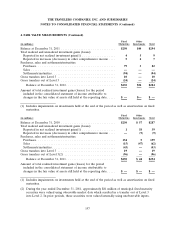
The following table summarizes, for all fixed maturities and equity securities reported at fair value
for which fair value is less than 80% of amortized cost at December 31, 2012, the gross unrealized
investment loss by length of time those securities have continuously been in an unrealized loss position
of greater than 20% of amortized cost:
Period For Which Fair Value Is Less Than 80% of Amortized Cost
Greater Than Greater Than
3 Months, 6 Months,
3 Months 6 Months 12 Months Greater Than
(in millions) or Less or Less or Less 12 Months Total
Fixed maturities:
Mortgage-backed securities ............ $— $— $— $— $—
Other ........................... —1 — 34
Total fixed maturities ............... —1 — 34
Equity securities ..................... —————
Total .............................. $— $1 $— $3 $4
188