Travelers 2012 Annual Report Download - page 130
Download and view the complete annual report
Please find page 130 of the 2012 Travelers annual report below. You can navigate through the pages in the report by either clicking on the pages listed below, or by using the keyword search tool below to find specific information within the annual report.-
 1
1 -
2
-
3
-
4
-
5
-
6
-
7
-
8
-
9
-
10
-
11
-
12
-
13
-
14
-
15
-
16
-
17
-
18
-
19
-
20
-
21
-
22
-
23
-
24
-
25
-
26
-
27
-
28
-
29
-
30
-
31
-
32
-
33
-
34
-
35
-
36
-
37
-
38
-
39
-
40
-
41
-
42
-
43
-
44
-
45
-
46
-
47
-
48
-
49
-
50
-
51
-
52
-
53
-
54
-
55
-
56
-
57
-
58
-
59
-
60
-
61
-
62
-
63
-
64
-
65
-
66
-
67
-
68
-
69
-
70
-
71
-
72
-
73
-
74
-
75
-
76
-
77
-
78
-
79
-
80
-
81
-
82
-
83
-
84
-
85
-
86
-
87
-
88
-
89
-
90
-
91
-
92
-
93
-
94
-
95
-
96
-
97
-
98
-
99
-
100
-
101
-
102
-
103
-
104
-
105
-
106
-
107
-
108
-
109
-
110
-
111
-
112
-
113
-
114
-
115
-
116
-
117
-
118
-
119
-
 120
120 -
 121
121 -
 122
122 -
 123
123 -
 124
124 -
 125
125 -
 126
126 -
 127
127 -
 128
128 -
 129
129 -
 130
130 -
 131
131 -
 132
132 -
 133
133 -
 134
134 -
 135
135 -
 136
136 -
 137
137 -
 138
138 -
 139
139 -
 140
140 -
141
-
142
-
143
-
144
-
145
-
146
-
147
-
148
-
149
-
150
-
151
-
152
-
153
-
154
-
155
-
156
-
157
-
158
-
159
-
160
-
161
-
162
-
163
-
164
-
165
-
166
-
167
-
168
-
169
-
170
-
171
-
172
-
173
-
174
-
175
-
176
-
177
-
178
-
179
-
180
-
181
-
182
-
183
-
184
-
185
-
186
-
187
-
188
-
189
-
190
-
191
-
192
-
193
-
194
-
195
-
196
-
197
-
198
-
199
-
200
-
201
-
202
-
203
-
204
-
205
-
206
-
207
-
208
-
209
-
210
-
211
-
212
-
213
-
214
-
215
-
216
-
217
-
218
-
219
-
220
-
221
-
222
-
223
-
224
-
225
-
226
-
227
-
228
-
229
-
230
-
231
-
232
-
233
-
234
-
235
-
236
-
237
-
238
-
239
-
240
-
241
-
242
-
243
-
244
-
245
-
246
-
247
-
248
-
249
-
250
-
251
-
252
-
253
-
254
-
255
-
256
-
257
-
258
-
259
-
260
-
261
-
262
-
263
-
264
-
265
-
266
-
267
-
268
-
269
-
270
-
271
-
272
-
273
-
274
-
275
-
276
-
277
-
278
-
279
-
280
-
281
-
282
-
283
-
284
-
285
-
286
-
287
-
288
-
289
-
290
-
291
-
292
-
293
-
294
-
295
-
296
-
297
-
298
-
299
-
300
 |
 |
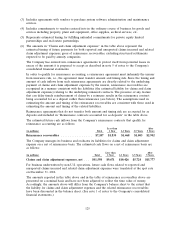
the Company estimates that the impact of lower reinvestment yields on the Company’s fixed maturity
portfolio could, in 2013, result in approximately $30 million of lower after-tax net investment income
from that portfolio on a quarterly basis as compared to the corresponding quarter of 2012. Given
recent general economic and investment market conditions, the Company expects investment income
from the non-fixed maturity portfolio for 2013 to be lower than in 2012. If general economic conditions
and/or investment market conditions deteriorate in 2013, the Company could also experience a
reduction in net investment income and/or significant realized investment losses, including impairments.
For further discussion of the Company’s investment portfolio, see ‘‘Item 7—Management’s Discussion
and Analysis of Financial Condition and Results of Operations—Investment Portfolio’’ in this report.
For a discussion of the risks to the Company’s business during or following a financial market
disruption and risks to the Company’s investment portfolio, see the risk factors entitled ‘‘During or
following a period of financial market disruption or economic downturn, our business could be
materially and adversely affected’’ and ‘‘Our investment portfolio may suffer reduced returns or
material realized or unrealized losses’’ included in ‘‘Risk Factors’’ in Part I, Item 1A of this report.
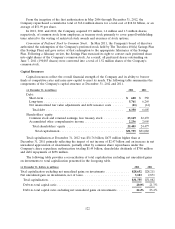
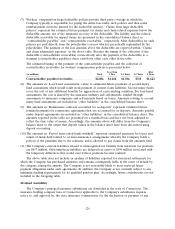
Capital Position. The Company believes it has a strong capital position and, as part of its ongoing
efforts to create shareholder value, expects to continue to return capital not needed to support its
business operations to its shareholders. In recent years, the Company has returned capital to its
shareholders, comprising dividends to common shareholders and common share repurchases, in
amounts that have exceeded its operating income. The Company now expects that, generally over time,
the combination of dividends to common shareholders and common share repurchases will likely not
exceed operating income. In addition, actual amounts of common share repurchases will also depend
on a variety of additional factors, including corporate and regulatory requirements, maintaining capital
levels commensurate with the Company’s existing ratings from independent rating agencies, share price,
funding of the Company’s qualified pension plan, strategic initiatives and other market conditions. For
information regarding the Company’s common share repurchases in 2012, see ‘‘Liquidity and Capital
Resources’’ in this report.
The Company had a net after-tax unrealized investment gain of $2.98 billion in its fixed maturity
investment portfolio at December 31, 2012. While the Company does not attempt to predict future
interest rate movements, a rising interest rate environment would reduce the market value of fixed
maturity investments and, therefore, reduce shareholders’ equity, and a declining interest rate
environment would have the opposite effects.
Many of the statements in this ‘‘Outlook’’ section are forward-looking statements, which are
subject to risks and uncertainties that are often difficult to predict and beyond the Company’s control.
Actual results could differ materially from those expressed or implied by such forward-looking
statements. Further, such forward-looking statements speak only as of the date of this report and the
Company undertakes no obligation to update them. See ‘‘—Forward-Looking Statements.’’ For a
discussion of potential risks and uncertainties that could impact the Company’s results of operations or
financial position, see ‘‘Item 1A—Risk Factors’’ and ‘‘Item 7—Management’s Discussion and Analysis
of Financial Condition and Results of Operations—Critical Accounting Estimates’’ in this report.
LIQUIDITY AND CAPITAL RESOURCES
Liquidity is a measure of a company’s ability to generate sufficient cash flows to meet the cash
requirements of its business operations and to satisfy general corporate purposes when needed. The
liquidity requirements of the Company have been met primarily by funds generated from premiums,
fees, income received on investments and investment maturities. Cash provided from these sources is
used primarily for claims and claim adjustment expense payments, operating expenses, debt servicing,
taxes, shareholder dividends and, in recent years, for common share repurchases. The timing and
amount of catastrophe claims are inherently unpredictable. Such claims increase liquidity requirements.
The timing and amount of reinsurance recoveries may be affected by reinsurer solvency and
118