Travelers 2012 Annual Report Download - page 152
Download and view the complete annual report
Please find page 152 of the 2012 Travelers annual report below. You can navigate through the pages in the report by either clicking on the pages listed below, or by using the keyword search tool below to find specific information within the annual report.-
 1
1 -
 2
2 -
 3
3 -
 4
4 -
 5
5 -
 6
6 -
 7
7 -
 8
8 -
 9
9 -
 10
10 -
 11
11 -
 12
12 -
 13
13 -
 14
14 -
 15
15 -
 16
16 -
 17
17 -
 18
18 -
 19
19 -
 20
20 -
 21
21 -
 22
22 -
 23
23 -
 24
24 -
 25
25 -
 26
26 -
 27
27 -
 28
28 -
 29
29 -
 30
30 -
 31
31 -
 32
32 -
 33
33 -
 34
34 -
 35
35 -
 36
36 -
 37
37 -
 38
38 -
 39
39 -
 40
40 -
 41
41 -
 42
42 -
 43
43 -
 44
44 -
 45
45 -
 46
46 -
 47
47 -
 48
48 -
 49
49 -
 50
50 -
 51
51 -
 52
52 -
 53
53 -
 54
54 -
 55
55 -
 56
56 -
 57
57 -
 58
58 -
 59
59 -
 60
60 -
 61
61 -
 62
62 -
 63
63 -
 64
64 -
 65
65 -
 66
66 -
 67
67 -
 68
68 -
 69
69 -
 70
70 -
 71
71 -
 72
72 -
 73
73 -
 74
74 -
 75
75 -
 76
76 -
 77
77 -
 78
78 -
 79
79 -
 80
80 -
 81
81 -
 82
82 -
 83
83 -
 84
84 -
 85
85 -
 86
86 -
 87
87 -
 88
88 -
 89
89 -
 90
90 -
 91
91 -
 92
92 -
 93
93 -
 94
94 -
 95
95 -
 96
96 -
 97
97 -
 98
98 -
 99
99 -
 100
100 -
 101
101 -
 102
102 -
 103
103 -
 104
104 -
 105
105 -
 106
106 -
 107
107 -
 108
108 -
 109
109 -
 110
110 -
 111
111 -
 112
112 -
 113
113 -
 114
114 -
 115
115 -
 116
116 -
 117
117 -
 118
118 -
 119
119 -
 120
120 -
 121
121 -
 122
122 -
 123
123 -
 124
124 -
 125
125 -
 126
126 -
 127
127 -
 128
128 -
 129
129 -
 130
130 -
 131
131 -
 132
132 -
 133
133 -
 134
134 -
 135
135 -
 136
136 -
 137
137 -
 138
138 -
 139
139 -
 140
140 -
 141
141 -
 142
142 -
 143
143 -
 144
144 -
 145
145 -
 146
146 -
 147
147 -
 148
148 -
 149
149 -
 150
150 -
 151
151 -
 152
152 -
 153
153 -
 154
154 -
 155
155 -
 156
156 -
 157
157 -
 158
158 -
 159
159 -
 160
160 -
 161
161 -
 162
162 -
 163
163 -
 164
164 -
 165
165 -
 166
166 -
 167
167 -
 168
168 -
 169
169 -
 170
170 -
 171
171 -
 172
172 -
 173
173 -
 174
174 -
 175
175 -
 176
176 -
 177
177 -
 178
178 -
 179
179 -
 180
180 -
 181
181 -
 182
182 -
 183
183 -
 184
184 -
 185
185 -
 186
186 -
 187
187 -
 188
188 -
 189
189 -
 190
190 -
 191
191 -
 192
192 -
 193
193 -
 194
194 -
 195
195 -
 196
196 -
 197
197 -
 198
198 -
 199
199 -
 200
200 -
 201
201 -
 202
202 -
 203
203 -
 204
204 -
 205
205 -
 206
206 -
 207
207 -
 208
208 -
 209
209 -
 210
210 -
 211
211 -
 212
212 -
 213
213 -
 214
214 -
 215
215 -
 216
216 -
 217
217 -
 218
218 -
 219
219 -
 220
220 -
 221
221 -
 222
222 -
 223
223 -
 224
224 -
 225
225 -
 226
226 -
 227
227 -
 228
228 -
 229
229 -
 230
230 -
 231
231 -
 232
232 -
 233
233 -
 234
234 -
 235
235 -
 236
236 -
 237
237 -
 238
238 -
 239
239 -
 240
240 -
 241
241 -
 242
242 -
 243
243 -
 244
244 -
 245
245 -
 246
246 -
 247
247 -
 248
248 -
 249
249 -
 250
250 -
 251
251 -
 252
252 -
 253
253 -
 254
254 -
 255
255 -
 256
256 -
 257
257 -
 258
258 -
 259
259 -
 260
260 -
 261
261 -
 262
262 -
 263
263 -
 264
264 -
 265
265 -
 266
266 -
 267
267 -
 268
268 -
 269
269 -
 270
270 -
 271
271 -
 272
272 -
 273
273 -
 274
274 -
 275
275 -
 276
276 -
 277
277 -
 278
278 -
 279
279 -
 280
280 -
 281
281 -
 282
282 -
 283
283 -
 284
284 -
 285
285 -
 286
286 -
 287
287 -
 288
288 -
 289
289 -
 290
290 -
 291
291 -
 292
292 -
 293
293 -
 294
294 -
 295
295 -
 296
296 -
 297
297 -
 298
298 -
 299
299 -
 300
300
 |
 |

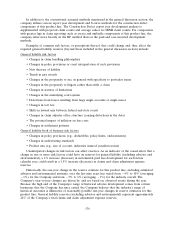
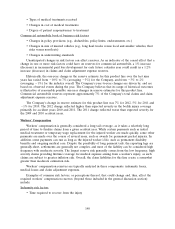
• Types of medical treatments received
• Changes in cost of medical treatments
• Degree of patient responsiveness to treatment
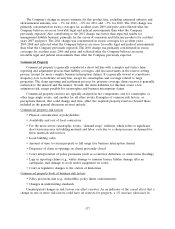
Commercial automobile book of business risk factors
• Changes in policy provisions (e.g., deductibles, policy limits, endorsements, etc.)
• Changes in mix of insured vehicles (e.g., long haul trucks versus local and smaller vehicles, fleet
risks versus non-fleets)
• Changes in underwriting standards
Unanticipated changes in risk factors can affect reserves. As an indicator of the causal effect that a
change in one or more risk factors could have on reserves for commercial automobile, a 1% increase
(decrease) in incremental paid loss development for each future calendar year could result in a 1.2%
increase (decrease) in claims and claim adjustment expense reserves.
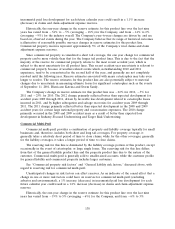
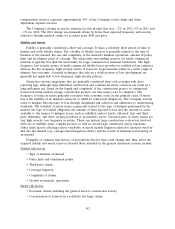
Historically, the one-year change in the reserve estimate for this product line over the last nine
years has varied from 10% to 7% (averaging 3%) for the Company, and from 3% to 2%
(averaging 1%) for the industry overall. The Company’s year-to-year changes are driven by, and are
based on, observed events during the year. The Company believes that its range of historical outcomes
is illustrative of reasonably possible one-year changes in reserve estimates for this product line.
Commercial automobile reserves represent approximately 7% of the Company’s total claims and claim
adjustment expense reserves.
The Company’s change in reserve estimate for this product line was 7% for 2012, 5% for 2011 and
1% for 2010. The 2012 change reflected higher than expected severity in the bodily injury coverage
primarily for accident years 2010 and 2011. The 2011 change reflected worse than expected severity for
the 2009 and 2010 accident years.
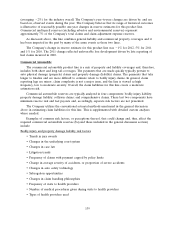
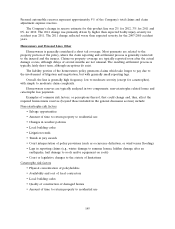
Workers’ Compensation
Workers’ compensation is generally considered a long tail coverage, as it takes a relatively long
period of time to finalize claims from a given accident year. While certain payments such as initial
medical treatment or temporary wage replacement for the injured worker are made quickly, some other
payments are made over the course of several years, such as awards for permanent partial injuries. In
addition, some payments can run as long as the injured worker’s life, such as permanent disability
benefits and on-going medical care. Despite the possibility of long payment tails, the reporting lags are
generally short, settlements are generally not complex, and most of the liability can be considered high
frequency with moderate severity. The largest reserve risk generally comes from the low frequency, high
severity claims providing lifetime coverage for medical expense arising from a worker’s injury, as such
claims are subject to greater inflation risk. Overall, the claim liabilities for this line create a somewhat
greater than moderate estimation risk.
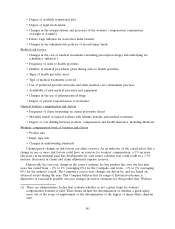
Workers’ compensation reserves are typically analyzed in three components: indemnity losses,
medical losses and claim adjustment expenses.
Examples of common risk factors, or perceptions thereof, that could change and, thus, affect the
required workers’ compensation reserves (beyond those included in the general discussion section)
include:
Indemnity risk factors
• Time required to recover from the injury
140
