Travelers 2012 Annual Report Download - page 115
Download and view the complete annual report
Please find page 115 of the 2012 Travelers annual report below. You can navigate through the pages in the report by either clicking on the pages listed below, or by using the keyword search tool below to find specific information within the annual report.-
 1
1 -
2
-
3
-
4
-
5
-
6
-
7
-
8
-
9
-
10
-
11
-
12
-
13
-
14
-
15
-
16
-
17
-
18
-
19
-
20
-
21
-
22
-
23
-
24
-
25
-
26
-
27
-
28
-
29
-
30
-
31
-
32
-
33
-
34
-
35
-
36
-
37
-
38
-
39
-
40
-
41
-
42
-
43
-
44
-
45
-
46
-
47
-
48
-
49
-
50
-
51
-
52
-
53
-
54
-
55
-
56
-
57
-
58
-
59
-
60
-
61
-
62
-
63
-
64
-
65
-
66
-
67
-
68
-
69
-
70
-
71
-
72
-
73
-
74
-
75
-
76
-
77
-
78
-
79
-
80
-
81
-
82
-
83
-
84
-
85
-
86
-
87
-
88
-
89
-
90
-
91
-
92
-
93
-
94
-
95
-
96
-
97
-
98
-
99
-
100
-
101
-
102
-
103
-
104
-
 105
105 -
 106
106 -
 107
107 -
 108
108 -
 109
109 -
 110
110 -
 111
111 -
 112
112 -
 113
113 -
 114
114 -
 115
115 -
 116
116 -
 117
117 -
 118
118 -
 119
119 -
 120
120 -
 121
121 -
 122
122 -
 123
123 -
 124
124 -
 125
125 -
126
-
127
-
128
-
129
-
130
-
131
-
132
-
133
-
134
-
135
-
136
-
137
-
138
-
139
-
140
-
141
-
142
-
143
-
144
-
145
-
146
-
147
-
148
-
149
-
150
-
151
-
152
-
153
-
154
-
155
-
156
-
157
-
158
-
159
-
160
-
161
-
162
-
163
-
164
-
165
-
166
-
167
-
168
-
169
-
170
-
171
-
172
-
173
-
174
-
175
-
176
-
177
-
178
-
179
-
180
-
181
-
182
-
183
-
184
-
185
-
186
-
187
-
188
-
189
-
190
-
191
-
192
-
193
-
194
-
195
-
196
-
197
-
198
-
199
-
200
-
201
-
202
-
203
-
204
-
205
-
206
-
207
-
208
-
209
-
210
-
211
-
212
-
213
-
214
-
215
-
216
-
217
-
218
-
219
-
220
-
221
-
222
-
223
-
224
-
225
-
226
-
227
-
228
-
229
-
230
-
231
-
232
-
233
-
234
-
235
-
236
-
237
-
238
-
239
-
240
-
241
-
242
-
243
-
244
-
245
-
246
-
247
-
248
-
249
-
250
-
251
-
252
-
253
-
254
-
255
-
256
-
257
-
258
-
259
-
260
-
261
-
262
-
263
-
264
-
265
-
266
-
267
-
268
-
269
-
270
-
271
-
272
-
273
-
274
-
275
-
276
-
277
-
278
-
279
-
280
-
281
-
282
-
283
-
284
-
285
-
286
-
287
-
288
-
289
-
290
-
291
-
292
-
293
-
294
-
295
-
296
-
297
-
298
-
299
-
300
 |
 |

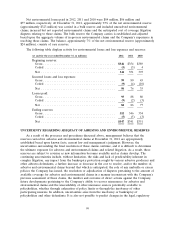
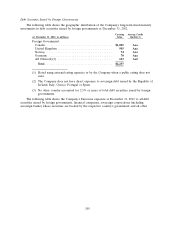
The following table shows the geographic distribution of the $29.66 billion of municipal bonds at
December 31, 2012 that were not pre-refunded.
State Local Total Average
General General Carrying Credit
(at December 31, 2012, in millions) Obligation Obligation Revenue Value Quality(1)
State:
Texas ............................... $ 426 $ 2,572 $ 1,214 $ 4,212 Aaa/Aa1
California ............................ 46 1,775 411 2,232 Aa2
Washington ........................... 273 793 497 1,563 Aa1
Virginia ............................. 183 673 681 1,537 Aaa/Aa1
Illinois .............................. 161 866 463 1,490 Aa1
Minnesota ........................... 306 746 234 1,286 Aaa/Aa1
Florida .............................. 345 42 830 1,217 Aa1
Massachusetts ......................... 188 28 914 1,130 Aaa/Aa1
Arizona ............................. — 495 609 1,104 Aa1
North Carolina ........................ 239 606 205 1,050 Aaa
Colorado ............................ — 679 197 876 Aa1
Georgia ............................. 201 376 288 865 Aaa/Aa1
Maryland ............................ 299 380 151 830 Aaa/Aa1
All Others(2) ......................... 1,976 3,498 4,790 10,264 Aa1
Total .............................. $4,643 $13,529 $11,484 $29,656 Aa1
(1) Rated using external rating agencies or by the Company when a public rating does not exist.
Ratings shown are the higher of the rating of the underlying issuer or the insurer in the case of
securities enhanced by third-party insurance for the payment of principal and interest in the event
of issuer default.
(2) No other single state accounted for 2.5% or more of the total pre-refunded municipal bonds.
103