Travelers 2012 Annual Report Download - page 191
Download and view the complete annual report
Please find page 191 of the 2012 Travelers annual report below. You can navigate through the pages in the report by either clicking on the pages listed below, or by using the keyword search tool below to find specific information within the annual report.-
 1
1 -
2
-
3
-
4
-
5
-
6
-
7
-
8
-
9
-
10
-
11
-
12
-
13
-
14
-
15
-
16
-
17
-
18
-
19
-
20
-
21
-
22
-
23
-
24
-
25
-
26
-
27
-
28
-
29
-
30
-
31
-
32
-
33
-
34
-
35
-
36
-
37
-
38
-
39
-
40
-
41
-
42
-
43
-
44
-
45
-
46
-
47
-
48
-
49
-
50
-
51
-
52
-
53
-
54
-
55
-
56
-
57
-
58
-
59
-
60
-
61
-
62
-
63
-
64
-
65
-
66
-
67
-
68
-
69
-
70
-
71
-
72
-
73
-
74
-
75
-
76
-
77
-
78
-
79
-
80
-
81
-
82
-
83
-
84
-
85
-
86
-
87
-
88
-
89
-
90
-
91
-
92
-
93
-
94
-
95
-
96
-
97
-
98
-
99
-
100
-
101
-
102
-
103
-
104
-
105
-
106
-
107
-
108
-
109
-
110
-
111
-
112
-
113
-
114
-
115
-
116
-
117
-
118
-
119
-
120
-
121
-
122
-
123
-
124
-
125
-
126
-
127
-
128
-
129
-
130
-
131
-
132
-
133
-
134
-
135
-
136
-
137
-
138
-
139
-
140
-
141
-
142
-
143
-
144
-
145
-
146
-
147
-
148
-
149
-
150
-
151
-
152
-
153
-
154
-
155
-
156
-
157
-
158
-
159
-
160
-
161
-
162
-
163
-
164
-
165
-
166
-
167
-
168
-
169
-
170
-
171
-
172
-
173
-
174
-
175
-
176
-
177
-
178
-
179
-
180
-
 181
181 -
 182
182 -
 183
183 -
 184
184 -
 185
185 -
 186
186 -
 187
187 -
 188
188 -
 189
189 -
 190
190 -
 191
191 -
 192
192 -
 193
193 -
 194
194 -
 195
195 -
 196
196 -
 197
197 -
 198
198 -
 199
199 -
 200
200 -
 201
201 -
202
-
203
-
204
-
205
-
206
-
207
-
208
-
209
-
210
-
211
-
212
-
213
-
214
-
215
-
216
-
217
-
218
-
219
-
220
-
221
-
222
-
223
-
224
-
225
-
226
-
227
-
228
-
229
-
230
-
231
-
232
-
233
-
234
-
235
-
236
-
237
-
238
-
239
-
240
-
241
-
242
-
243
-
244
-
245
-
246
-
247
-
248
-
249
-
250
-
251
-
252
-
253
-
254
-
255
-
256
-
257
-
258
-
259
-
260
-
261
-
262
-
263
-
264
-
265
-
266
-
267
-
268
-
269
-
270
-
271
-
272
-
273
-
274
-
275
-
276
-
277
-
278
-
279
-
280
-
281
-
282
-
283
-
284
-
285
-
286
-
287
-
288
-
289
-
290
-
291
-
292
-
293
-
294
-
295
-
296
-
297
-
298
-
299
-
300
 |
 |

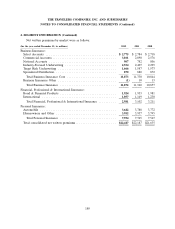
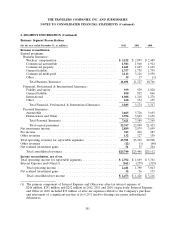
THE TRAVELERS COMPANIES, INC. AND SUBSIDIARIES
NOTES TO CONSOLIDATED FINANCIAL STATEMENTS (Continued)
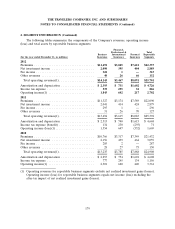
2. SEGMENT INFORMATION (Continued)
The following tables summarize the components of the Company’s revenues, operating income
(loss) and total assets by reportable business segments:
Financial,
Professional & Total
Business International Personal Reportable
(for the year ended December 31, in millions) Insurance Insurance Insurance Segments
2012
Premiums .................................. $11,691 $3,045 $7,621 $22,357
Net investment income ........................ 2,090 395 404 2,889
Fee income ................................. 322 1 — 323
Other revenues .............................. 40 26 66 132
Total operating revenues(1) .................... $14,143 $3,467 $8,091 $25,701
Amortization and depreciation ................... $ 2,393 $ 731 $1,602 $ 4,726
Income tax expense ........................... 539 255 32 826
Operating income(1) .......................... 1,843 642 217 2,702
2011
Premiums .................................. $11,327 $3,174 $7,589 $22,090
Net investment income ........................ 2,041 414 424 2,879
Fee income ................................. 295 1 — 296
Other revenues .............................. 31 26 70 127
Total operating revenues(1) .................... $13,694 $3,615 $8,083 $25,392
Amortization and depreciation ................... $ 2,313 $ 740 $1,615 $ 4,668
Income tax expense (benefit) .................... 134 230 (293) 71
Operating income (loss)(1) ...................... 1,354 647 (332) 1,669
2010
Premiums .................................. $10,766 $3,317 $7,349 $21,432
Net investment income ........................ 2,156 439 464 3,059
Fee income ................................. 285 2 — 287
Other revenues .............................. 28 27 75 130
Total operating revenues(1) .................... $13,235 $3,785 $7,888 $24,908
Amortization and depreciation ................... $ 2,253 $ 754 $1,601 $ 4,608
Income tax expense ........................... 777 245 134 1,156
Operating income(1) .......................... 2,301 620 440 3,361
(1) Operating revenues for reportable business segments exclude net realized investment gains (losses).
Operating income (loss) for reportable business segments equals net income (loss) excluding the
after-tax impact of net realized investment gains (losses).
179