Travelers 2012 Annual Report Download - page 4
Download and view the complete annual report
Please find page 4 of the 2012 Travelers annual report below. You can navigate through the pages in the report by either clicking on the pages listed below, or by using the keyword search tool below to find specific information within the annual report.-
 1
1 -
 2
2 -
 3
3 -
 4
4 -
 5
5 -
 6
6 -
 7
7 -
 8
8 -
 9
9 -
 10
10 -
 11
11 -
 12
12 -
 13
13 -
 14
14 -
 15
15 -
16
-
17
-
18
-
19
-
20
-
21
-
22
-
23
-
24
-
25
-
26
-
27
-
28
-
29
-
30
-
31
-
32
-
33
-
34
-
35
-
36
-
37
-
38
-
39
-
40
-
41
-
42
-
43
-
44
-
45
-
46
-
47
-
48
-
49
-
50
-
51
-
52
-
53
-
54
-
55
-
56
-
57
-
58
-
59
-
60
-
61
-
62
-
63
-
64
-
65
-
66
-
67
-
68
-
69
-
70
-
71
-
72
-
73
-
74
-
75
-
76
-
77
-
78
-
79
-
80
-
81
-
82
-
83
-
84
-
85
-
86
-
87
-
88
-
89
-
90
-
91
-
92
-
93
-
94
-
95
-
96
-
97
-
98
-
99
-
100
-
101
-
102
-
103
-
104
-
105
-
106
-
107
-
108
-
109
-
110
-
111
-
112
-
113
-
114
-
115
-
116
-
117
-
118
-
119
-
120
-
121
-
122
-
123
-
124
-
125
-
126
-
127
-
128
-
129
-
130
-
131
-
132
-
133
-
134
-
135
-
136
-
137
-
138
-
139
-
140
-
141
-
142
-
143
-
144
-
145
-
146
-
147
-
148
-
149
-
150
-
151
-
152
-
153
-
154
-
155
-
156
-
157
-
158
-
159
-
160
-
161
-
162
-
163
-
164
-
165
-
166
-
167
-
168
-
169
-
170
-
171
-
172
-
173
-
174
-
175
-
176
-
177
-
178
-
179
-
180
-
181
-
182
-
183
-
184
-
185
-
186
-
187
-
188
-
189
-
190
-
191
-
192
-
193
-
194
-
195
-
196
-
197
-
198
-
199
-
200
-
201
-
202
-
203
-
204
-
205
-
206
-
207
-
208
-
209
-
210
-
211
-
212
-
213
-
214
-
215
-
216
-
217
-
218
-
219
-
220
-
221
-
222
-
223
-
224
-
225
-
226
-
227
-
228
-
229
-
230
-
231
-
232
-
233
-
234
-
235
-
236
-
237
-
238
-
239
-
240
-
241
-
242
-
243
-
244
-
245
-
246
-
247
-
248
-
249
-
250
-
251
-
252
-
253
-
254
-
255
-
256
-
257
-
258
-
259
-
260
-
261
-
262
-
263
-
264
-
265
-
266
-
267
-
268
-
269
-
270
-
271
-
272
-
273
-
274
-
275
-
276
-
277
-
278
-
279
-
280
-
281
-
282
-
283
-
284
-
285
-
286
-
287
-
288
-
289
-
290
-
291
-
292
-
293
-
294
-
295
-
296
-
297
-
298
-
299
-
300
 |
 |

TRAVELERS Annual Report
weather losses have come increasingly from inland wind tornadoes
and hail This adds to the uncertainty of weather as inland wind as
compared to coastal wind hurricanes is more diffi cult to predict
and model Also while coastal wind predictably impacts specifi c
coastal regions much of the country is vulnerable to inland wind
In addition to the weather our results in and in recent years
have been aff ected by the impact of historically low interest rates
on our investment portfolio
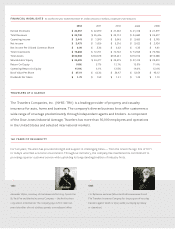
Reliability — Years in the making
We have been managing our business for these conditions for
years Our philosophy of running the business for the long term
enables us to address challenges from a position of strength and
organizational readiness Our fi nancial foundation is solid We
carefully balance risk and reward in both our insurance operations
and our investment portfolio And a storm like Sandy extreme as
it was was in our playbook of possibilities both in terms of our
understanding of our exposure to severe events and the response
strategy we put in place following Hurricane Katrina in
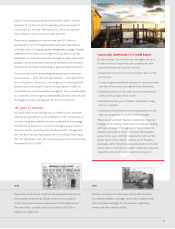
More specifi cally we started to take action in response to the
weather patterns and low interest rates in the middle of
Consistent with our approach of focusing on producing top tier
returns over time we embarked on a deliberate carefully calibrated
strategy of selectively but actively raising rates and improving
terms and conditions on our insurance policies Our results in
benefi tted from that strategy Improved underwriting margins in
each of our segments contributed signifi cantly to our profi tability
After the Titanic sinks Travelers pays more than million to
benefi ciaries in accident claims and life insurance benefi ts
Travelers issues the fi rst insurance on aerial transportation
which includes public liability property damage and workers’
compensation President Woodrow Wilson is one of the fi rst
individuals covered by such insurance
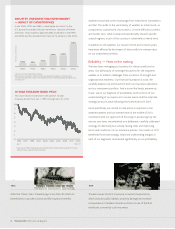
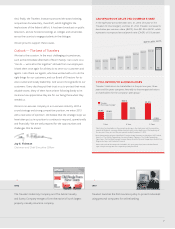
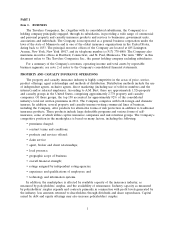
INDUSTRY UNDERWRITING ENVIRONMENT
— IMPACT OF CATASTROPHES
In the 1960s, 1970s and 1980s, catastrophe loss costs* in the
U.S. property-casualty industry were about 1 percent of written
premiums. That jumped to approximately 3.5 percent in the 1990s
and 2000s and has doubled from there to 7.2 percent in the 2010s.
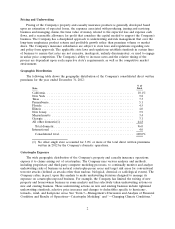
-YEAR TREASURY BOND YIELD
This chart shows the decline in the yield of 10-year
Treasury bonds from Jan. 1, 1995, through Dec. 31, 2012.
Source Insurance Information Institute
Note Private carrier losses only Excludes loss adjustment expenses and reinsurance
reinstatement premiums Figures are adjusted for losses ultimately paid by foreign insurers
and reinsurers
s
%
s
%
s
%
s
%
s
%
s
%
Percent of Premium
Jan Dec
Data Source FRED Federal Reserve Economic Data Federal Reserve Bank of St Louis
Year Treasury Constant Maturity Rate
0
1
2
3
4
5
6
7
8%