Travelers 2012 Annual Report Download - page 220
Download and view the complete annual report
Please find page 220 of the 2012 Travelers annual report below. You can navigate through the pages in the report by either clicking on the pages listed below, or by using the keyword search tool below to find specific information within the annual report.-
 1
1 -
2
-
3
-
4
-
5
-
6
-
7
-
8
-
9
-
10
-
11
-
12
-
13
-
14
-
15
-
16
-
17
-
18
-
19
-
20
-
21
-
22
-
23
-
24
-
25
-
26
-
27
-
28
-
29
-
30
-
31
-
32
-
33
-
34
-
35
-
36
-
37
-
38
-
39
-
40
-
41
-
42
-
43
-
44
-
45
-
46
-
47
-
48
-
49
-
50
-
51
-
52
-
53
-
54
-
55
-
56
-
57
-
58
-
59
-
60
-
61
-
62
-
63
-
64
-
65
-
66
-
67
-
68
-
69
-
70
-
71
-
72
-
73
-
74
-
75
-
76
-
77
-
78
-
79
-
80
-
81
-
82
-
83
-
84
-
85
-
86
-
87
-
88
-
89
-
90
-
91
-
92
-
93
-
94
-
95
-
96
-
97
-
98
-
99
-
100
-
101
-
102
-
103
-
104
-
105
-
106
-
107
-
108
-
109
-
110
-
111
-
112
-
113
-
114
-
115
-
116
-
117
-
118
-
119
-
120
-
121
-
122
-
123
-
124
-
125
-
126
-
127
-
128
-
129
-
130
-
131
-
132
-
133
-
134
-
135
-
136
-
137
-
138
-
139
-
140
-
141
-
142
-
143
-
144
-
145
-
146
-
147
-
148
-
149
-
150
-
151
-
152
-
153
-
154
-
155
-
156
-
157
-
158
-
159
-
160
-
161
-
162
-
163
-
164
-
165
-
166
-
167
-
168
-
169
-
170
-
171
-
172
-
173
-
174
-
175
-
176
-
177
-
178
-
179
-
180
-
181
-
182
-
183
-
184
-
185
-
186
-
187
-
188
-
189
-
190
-
191
-
192
-
193
-
194
-
195
-
196
-
197
-
198
-
199
-
200
-
201
-
202
-
203
-
204
-
205
-
206
-
207
-
208
-
209
-
 210
210 -
 211
211 -
 212
212 -
 213
213 -
 214
214 -
 215
215 -
 216
216 -
 217
217 -
 218
218 -
 219
219 -
 220
220 -
 221
221 -
 222
222 -
 223
223 -
 224
224 -
 225
225 -
 226
226 -
 227
227 -
 228
228 -
 229
229 -
 230
230 -
231
-
232
-
233
-
234
-
235
-
236
-
237
-
238
-
239
-
240
-
241
-
242
-
243
-
244
-
245
-
246
-
247
-
248
-
249
-
250
-
251
-
252
-
253
-
254
-
255
-
256
-
257
-
258
-
259
-
260
-
261
-
262
-
263
-
264
-
265
-
266
-
267
-
268
-
269
-
270
-
271
-
272
-
273
-
274
-
275
-
276
-
277
-
278
-
279
-
280
-
281
-
282
-
283
-
284
-
285
-
286
-
287
-
288
-
289
-
290
-
291
-
292
-
293
-
294
-
295
-
296
-
297
-
298
-
299
-
300
 |
 |
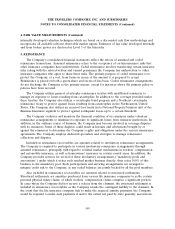
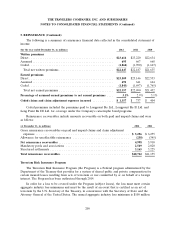
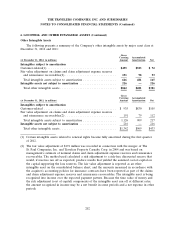
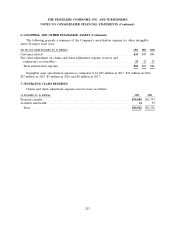
THE TRAVELERS COMPANIES, INC. AND SUBSIDIARIES
NOTES TO CONSOLIDATED FINANCIAL STATEMENTS (Continued)
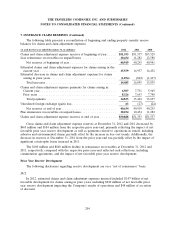
7. INSURANCE CLAIM RESERVES (Continued)
• while overall payment patterns have been generally stable, there has been an increase in severity
for certain policyholders due to the continued high level of litigation activity;
• continued moderate level of asbestos-related bankruptcy activity; and
• the absence of new theories of liability or new classes of defendants.
While the Company believes that over the past several years there has been a reduction in the
volatility associated with the Company’s overall asbestos exposure, there nonetheless remains a high
degree of uncertainty with respect to future exposure from asbestos claims.
During 2012, total gross and net asbestos-related payments decreased when compared with 2011,
primarily resulting from a decline in both gross and net payments to policyholders with whom the
Company has entered into settlement agreements. The Home Office and Field Office categories, which
account for the vast majority of policyholders with active asbestos-related claims, experienced a modest
reduction in gross asbestos-related payments during 2012 when compared with 2011, while net asbestos
payments were flat. Payments on behalf of policyholders in these categories continue to be influenced
by the high level of litigation activity in a limited number of jurisdictions where individuals alleging
serious asbestos-related injury continue to target previously peripheral defendants. The number of
policyholders tendering asbestos claims for the first time in 2012 and the number of policyholders with
open asbestos claims both increased slightly when compared with 2011.
The Company’s quarterly asbestos reserve reviews include an analysis of exposure and claim
payment patterns by policyholder category, as well as recent settlements, policyholder bankruptcies,
judicial rulings and legislative actions. The Company also analyzes developing payment patterns among
policyholders in the Home Office, Field Office and Assumed Reinsurance and Other categories as well
as projected reinsurance billings and recoveries. In addition, the Company reviews its historical gross
and net loss and expense paid experience, year-by-year, to assess any emerging trends, fluctuations, or
characteristics suggested by the aggregate paid activity. Conventional actuarial methods are not utilized
to establish asbestos reserves nor have the Company’s evaluations resulted in any way of determining a
meaningful average asbestos defense or indemnity payment.
The completion of these reviews and analyses in 2012, 2011 and 2010 resulted in $175 million,
$175 million and $140 million increases, respectively, in the Company’s net asbestos reserves in each
period. In each year, the reserve increases were primarily driven by increases in the Company’s
estimate of projected settlement and defense costs related to a broad number of policyholders in the
Home Office category and by higher projected payments on assumed reinsurance accounts. The
increase in the estimate of projected settlement and defense costs resulted from payment trends that
continue to be moderately higher than previously anticipated due to the impact of the current litigation
environment discussed above. The increase in 2010 also reflected increases in costs of litigating
asbestos-related coverage matters and was partially offset by a $70 million benefit from the reduction in
the allowance for uncollectible reinsurance resulting from a favorable ruling related to a reinsurance
dispute. Notwithstanding these trends, the Company’s overall view of the underlying asbestos
environment is essentially unchanged from recent periods, and there remains a high degree of
uncertainty with respect to future exposure to asbestos claims.
Net asbestos losses paid in 2012, 2011 and 2010 were $236 million, $284 million and $350 million,
respectively. Approximately 6%, 19% and 32% of total net paid losses in 2012, 2011 and 2010,
208