Travelers 2012 Annual Report Download - page 28
Download and view the complete annual report
Please find page 28 of the 2012 Travelers annual report below. You can navigate through the pages in the report by either clicking on the pages listed below, or by using the keyword search tool below to find specific information within the annual report.-
 1
1 -
2
-
3
-
4
-
5
-
6
-
7
-
8
-
9
-
10
-
11
-
12
-
13
-
14
-
15
-
16
-
17
-
 18
18 -
 19
19 -
 20
20 -
 21
21 -
 22
22 -
 23
23 -
 24
24 -
 25
25 -
 26
26 -
 27
27 -
 28
28 -
 29
29 -
 30
30 -
 31
31 -
 32
32 -
 33
33 -
 34
34 -
 35
35 -
 36
36 -
 37
37 -
 38
38 -
39
-
40
-
41
-
42
-
43
-
44
-
45
-
46
-
47
-
48
-
49
-
50
-
51
-
52
-
53
-
54
-
55
-
56
-
57
-
58
-
59
-
60
-
61
-
62
-
63
-
64
-
65
-
66
-
67
-
68
-
69
-
70
-
71
-
72
-
73
-
74
-
75
-
76
-
77
-
78
-
79
-
80
-
81
-
82
-
83
-
84
-
85
-
86
-
87
-
88
-
89
-
90
-
91
-
92
-
93
-
94
-
95
-
96
-
97
-
98
-
99
-
100
-
101
-
102
-
103
-
104
-
105
-
106
-
107
-
108
-
109
-
110
-
111
-
112
-
113
-
114
-
115
-
116
-
117
-
118
-
119
-
120
-
121
-
122
-
123
-
124
-
125
-
126
-
127
-
128
-
129
-
130
-
131
-
132
-
133
-
134
-
135
-
136
-
137
-
138
-
139
-
140
-
141
-
142
-
143
-
144
-
145
-
146
-
147
-
148
-
149
-
150
-
151
-
152
-
153
-
154
-
155
-
156
-
157
-
158
-
159
-
160
-
161
-
162
-
163
-
164
-
165
-
166
-
167
-
168
-
169
-
170
-
171
-
172
-
173
-
174
-
175
-
176
-
177
-
178
-
179
-
180
-
181
-
182
-
183
-
184
-
185
-
186
-
187
-
188
-
189
-
190
-
191
-
192
-
193
-
194
-
195
-
196
-
197
-
198
-
199
-
200
-
201
-
202
-
203
-
204
-
205
-
206
-
207
-
208
-
209
-
210
-
211
-
212
-
213
-
214
-
215
-
216
-
217
-
218
-
219
-
220
-
221
-
222
-
223
-
224
-
225
-
226
-
227
-
228
-
229
-
230
-
231
-
232
-
233
-
234
-
235
-
236
-
237
-
238
-
239
-
240
-
241
-
242
-
243
-
244
-
245
-
246
-
247
-
248
-
249
-
250
-
251
-
252
-
253
-
254
-
255
-
256
-
257
-
258
-
259
-
260
-
261
-
262
-
263
-
264
-
265
-
266
-
267
-
268
-
269
-
270
-
271
-
272
-
273
-
274
-
275
-
276
-
277
-
278
-
279
-
280
-
281
-
282
-
283
-
284
-
285
-
286
-
287
-
288
-
289
-
290
-
291
-
292
-
293
-
294
-
295
-
296
-
297
-
298
-
299
-
300
 |
 |

from collision, fire, flood, hail and theft. In addition, many states require policies to provide
first-party personal injury protection, frequently referred to as no-fault coverage.
•Homeowners and Other provides protection against losses to dwellings and contents from a
variety of perils (excluding flooding) as well as coverage for personal liability. The Company
writes homeowners insurance for dwellings, condominiums and tenants, and rental properties.
The Company writes coverage for boats and yachts and valuable personal items such as jewelry,
and also writes coverages for umbrella liability, identity fraud, and weddings and special events.
Net Retention Policy
The following describes the Company’s retention policy with respect to the Personal Insurance
segment as of January 1, 2013. The Company generally retains its primary personal auto exposures in
their entirety. For personal property insurance, there is an $8.0 million maximum retention per risk.
Personal Insurance retains the first $10.0 million of umbrella policies and purchases facultative
reinsurance to provide additional limits capacity or to reduce retentions on an individual risk basis. The
Company may also retain amounts greater than those described herein based on the individual
characteristics of the risk.
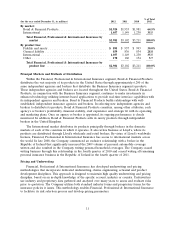
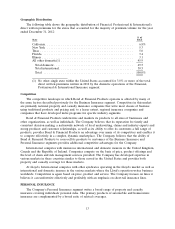
Geographic Distribution
The following table shows the geographic distribution of Personal Insurance’s direct written
premiums for the states that accounted for the majority of premium volume for the year ended
December 31, 2012:
% of
State Total
New York ................................................. 14.9%
Texas(1) ................................................... 7.8
Pennsylvania ................................................ 7.6
California .................................................. 6.3
Florida ................................................... 5.4
New Jersey ................................................ 5.1
Georgia ................................................... 4.4
Connecticut ................................................ 4.2
Virginia ................................................... 4.1
Massachusetts .............................................. 3.7
Maryland .................................................. 3.4
All others(2) ............................................... 33.1
Total ................................................... 100.0%
(1) The percentage for Texas includes business written by the Company through a fronting
agreement with another insurer.
(2) No other single state accounted for 3.0% or more of the total direct written premiums
written in 2012 by the Personal Insurance segment.
Competition
Although national companies write the majority of this business, Personal Insurance also faces
competition from many regional and hundreds of local companies. Personal Insurance primarily
competes based on breadth of product offerings, price, service (including claims handling), ease of
doing business, stability of the insurer and name recognition. Personal Insurance competes for business
within each independent agency since these agencies also offer policies of competing companies. At the
agency level, competition is primarily based on price, service (including claims handling), the level of
16