Travelers 2012 Annual Report Download - page 102
Download and view the complete annual report
Please find page 102 of the 2012 Travelers annual report below. You can navigate through the pages in the report by either clicking on the pages listed below, or by using the keyword search tool below to find specific information within the annual report.-
 1
1 -
2
-
3
-
4
-
5
-
6
-
7
-
8
-
9
-
10
-
11
-
12
-
13
-
14
-
15
-
16
-
17
-
18
-
19
-
20
-
21
-
22
-
23
-
24
-
25
-
26
-
27
-
28
-
29
-
30
-
31
-
32
-
33
-
34
-
35
-
36
-
37
-
38
-
39
-
40
-
41
-
42
-
43
-
44
-
45
-
46
-
47
-
48
-
49
-
50
-
51
-
52
-
53
-
54
-
55
-
56
-
57
-
58
-
59
-
60
-
61
-
62
-
63
-
64
-
65
-
66
-
67
-
68
-
69
-
70
-
71
-
72
-
73
-
74
-
75
-
76
-
77
-
78
-
79
-
80
-
81
-
82
-
83
-
84
-
85
-
86
-
87
-
88
-
89
-
90
-
91
-
 92
92 -
 93
93 -
 94
94 -
 95
95 -
 96
96 -
 97
97 -
 98
98 -
 99
99 -
 100
100 -
 101
101 -
 102
102 -
 103
103 -
 104
104 -
 105
105 -
 106
106 -
 107
107 -
 108
108 -
 109
109 -
 110
110 -
 111
111 -
 112
112 -
113
-
114
-
115
-
116
-
117
-
118
-
119
-
120
-
121
-
122
-
123
-
124
-
125
-
126
-
127
-
128
-
129
-
130
-
131
-
132
-
133
-
134
-
135
-
136
-
137
-
138
-
139
-
140
-
141
-
142
-
143
-
144
-
145
-
146
-
147
-
148
-
149
-
150
-
151
-
152
-
153
-
154
-
155
-
156
-
157
-
158
-
159
-
160
-
161
-
162
-
163
-
164
-
165
-
166
-
167
-
168
-
169
-
170
-
171
-
172
-
173
-
174
-
175
-
176
-
177
-
178
-
179
-
180
-
181
-
182
-
183
-
184
-
185
-
186
-
187
-
188
-
189
-
190
-
191
-
192
-
193
-
194
-
195
-
196
-
197
-
198
-
199
-
200
-
201
-
202
-
203
-
204
-
205
-
206
-
207
-
208
-
209
-
210
-
211
-
212
-
213
-
214
-
215
-
216
-
217
-
218
-
219
-
220
-
221
-
222
-
223
-
224
-
225
-
226
-
227
-
228
-
229
-
230
-
231
-
232
-
233
-
234
-
235
-
236
-
237
-
238
-
239
-
240
-
241
-
242
-
243
-
244
-
245
-
246
-
247
-
248
-
249
-
250
-
251
-
252
-
253
-
254
-
255
-
256
-
257
-
258
-
259
-
260
-
261
-
262
-
263
-
264
-
265
-
266
-
267
-
268
-
269
-
270
-
271
-
272
-
273
-
274
-
275
-
276
-
277
-
278
-
279
-
280
-
281
-
282
-
283
-
284
-
285
-
286
-
287
-
288
-
289
-
290
-
291
-
292
-
293
-
294
-
295
-
296
-
297
-
298
-
299
-
300
 |
 |
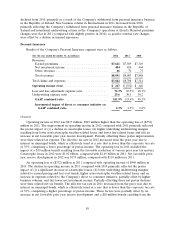
favorable resolution of various prior year tax matters. Catastrophe losses in 2011 were $1.49 billion,
compared with $594 million in 2010. Net favorable prior year reserve development in 2011 was
$110 million, compared with $87 million in 2010.
Revenues
Earned Premiums
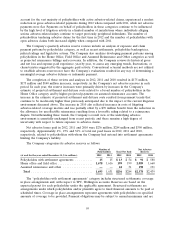
Earned premiums in 2012 were $7.62 billion, $32 million or less than 1% higher than in 2011.
Earned premiums of $7.59 billion in 2011 were $240 million or 3% higher than in 2010.
Net Investment Income
Net investment income in 2012 was $404 million, $20 million or 5% lower than in 2011, primarily
due to lower net investment income from fixed maturity investments, partially offset by higher net
investment income generated by non-fixed maturity investments. Net investment income in 2011 was
$424 million, $40 million or 9% lower than in 2010, primarily due to lower net investment income from
fixed maturity investments. Refer to the ‘‘Net Investment Income’’ section of ‘‘Consolidated Results of
Operations’’ herein for a discussion of the change in the Company’s net investment income in 2012 and
2011 as compared with the respective prior year. In addition, refer to note 2 of notes to the Company’s
consolidated financial statements herein for a discussion of the Company’s net investment income
allocation methodology.
Claims and Expenses
Claims and Claim Adjustment Expenses
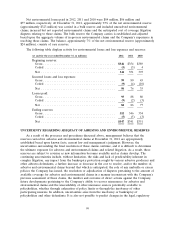
Claims and claim adjustment expenses in 2012 were $5.50 billion, $837 million or 13% lower than
in 2011. The decrease primarily reflected (i) a decline in catastrophe losses and, to a lesser extent,
(ii) lower non-catastrophe weather-related losses, (iii) lower fire-related losses and (iv) higher net
favorable prior year reserve development, partially offset by (v) the impact of loss cost trends, including
a higher number of severe bodily injury claims in the automobile line of business. Catastrophe losses in
2012 were $1.02 billion, compared with $1.49 billion in 2011. Net favorable prior year reserve
development in 2012 was $175 million, compared with $110 million in 2011. Factors contributing to net
favorable prior year reserve development are discussed in more detail in note 7 of notes to the
Company’s consolidated financial statements.
Claims and claim adjustment expenses in 2011 were $6.34 billion, $1.34 billion or 27% higher than
in 2010. The increase primarily reflected (i) the significant increase in catastrophe losses, (ii) the impact
of loss cost trends, (iii) higher non-catastrophe weather-related losses and (iv) higher business volumes.
These factors were partially offset by an increase in net favorable prior year reserve development.
Catastrophe losses in 2011 and 2010 were $1.49 billion and $594 million, respectively. Net favorable
prior year reserve development in 2011 and 2010 was $110 million and $87 million, respectively. Factors
contributing to net favorable prior year reserve development are discussed in more detail in note 7 of
notes to the Company’s consolidated financial statements.
Amortization of Deferred Acquisition Costs
The amortization of deferred acquisition costs in 2012 was $1.44 billion, $21 million or 1% lower
than in 2011. The amortization of deferred acquisition costs in 2011 was $1.46 billion, $17 million or
1% higher than in 2010. The changes in deferred acquisition costs in both 2012 and 2011 differed from
the change in earned premiums, primarily reflecting an increase in the number of agents reverting to a
contingent commission compensation program (the costs of which are classified in ‘‘general and
administrative expenses’’) from a fixed-value compensation program (the costs of which are classified in
90