Travelers 2012 Annual Report Download - page 84
Download and view the complete annual report
Please find page 84 of the 2012 Travelers annual report below. You can navigate through the pages in the report by either clicking on the pages listed below, or by using the keyword search tool below to find specific information within the annual report.-
 1
1 -
2
-
3
-
4
-
5
-
6
-
7
-
8
-
9
-
10
-
11
-
12
-
13
-
14
-
15
-
16
-
17
-
18
-
19
-
20
-
21
-
22
-
23
-
24
-
25
-
26
-
27
-
28
-
29
-
30
-
31
-
32
-
33
-
34
-
35
-
36
-
37
-
38
-
39
-
40
-
41
-
42
-
43
-
44
-
45
-
46
-
47
-
48
-
49
-
50
-
51
-
52
-
53
-
54
-
55
-
56
-
57
-
58
-
59
-
60
-
61
-
62
-
63
-
64
-
65
-
66
-
67
-
68
-
69
-
70
-
71
-
72
-
73
-
 74
74 -
 75
75 -
 76
76 -
 77
77 -
 78
78 -
 79
79 -
 80
80 -
 81
81 -
 82
82 -
 83
83 -
 84
84 -
 85
85 -
 86
86 -
 87
87 -
 88
88 -
 89
89 -
 90
90 -
 91
91 -
 92
92 -
 93
93 -
 94
94 -
95
-
96
-
97
-
98
-
99
-
100
-
101
-
102
-
103
-
104
-
105
-
106
-
107
-
108
-
109
-
110
-
111
-
112
-
113
-
114
-
115
-
116
-
117
-
118
-
119
-
120
-
121
-
122
-
123
-
124
-
125
-
126
-
127
-
128
-
129
-
130
-
131
-
132
-
133
-
134
-
135
-
136
-
137
-
138
-
139
-
140
-
141
-
142
-
143
-
144
-
145
-
146
-
147
-
148
-
149
-
150
-
151
-
152
-
153
-
154
-
155
-
156
-
157
-
158
-
159
-
160
-
161
-
162
-
163
-
164
-
165
-
166
-
167
-
168
-
169
-
170
-
171
-
172
-
173
-
174
-
175
-
176
-
177
-
178
-
179
-
180
-
181
-
182
-
183
-
184
-
185
-
186
-
187
-
188
-
189
-
190
-
191
-
192
-
193
-
194
-
195
-
196
-
197
-
198
-
199
-
200
-
201
-
202
-
203
-
204
-
205
-
206
-
207
-
208
-
209
-
210
-
211
-
212
-
213
-
214
-
215
-
216
-
217
-
218
-
219
-
220
-
221
-
222
-
223
-
224
-
225
-
226
-
227
-
228
-
229
-
230
-
231
-
232
-
233
-
234
-
235
-
236
-
237
-
238
-
239
-
240
-
241
-
242
-
243
-
244
-
245
-
246
-
247
-
248
-
249
-
250
-
251
-
252
-
253
-
254
-
255
-
256
-
257
-
258
-
259
-
260
-
261
-
262
-
263
-
264
-
265
-
266
-
267
-
268
-
269
-
270
-
271
-
272
-
273
-
274
-
275
-
276
-
277
-
278
-
279
-
280
-
281
-
282
-
283
-
284
-
285
-
286
-
287
-
288
-
289
-
290
-
291
-
292
-
293
-
294
-
295
-
296
-
297
-
298
-
299
-
300
 |
 |

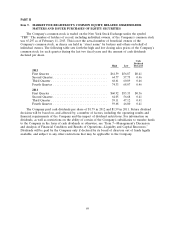
Item 6. SELECTED FINANCIAL DATA
At and for the year ended December 31,
2012 2011 2010 2009 2008
(in millions, except per share amounts)
Total revenues ........................ $ 25,740 $ 25,446 $ 25,112 $ 24,680 $ 24,477
Net income .......................... $ 2,473 $ 1,426 $ 3,216 $ 3,622 $ 2,924
Total investments ...................... $ 73,838 $ 72,701 $ 72,722 $ 74,965 $ 70,738
Total assets .......................... 104,938 104,575 105,631 110,013 110,088
Claims and claim adjustment expense reserves . 50,922 51,392 51,581 53,580 55,179
Total long-term debt .................... 5,750 6,255 6,502 6,154 5,939
Total liabilities ........................ 79,533 80,098 80,156 82,598 84,769
Total shareholders’ equity ................ 25,405 24,477 25,475 27,415 25,319
Net income per share(1):
Basic ............................... $ 6.35 $ 3.40 $ 6.69 $ 6.38 $ 4.87
Diluted ............................. $ 6.30 $ 3.36 $ 6.62 $ 6.33 $ 4.81
Year-end common shares outstanding ....... 377.4 392.8 434.6 520.3 585.1
Per common share amounts:
Cash dividends ........................ $ 1.79 $ 1.59 $ 1.41 $ 1.23 $ 1.19
Book value .......................... $ 67.31 $ 62.32 $ 58.47 $ 52.54 $ 43.12
(1) On January 1, 2009, the Company adopted the FASB’s updated accounting guidance related to
earnings per share. The impact of the adoption of this guidance was a reduction of previously
reported basic and diluted earnings per share for the year ended December 31, 2008 by $0.03 per
share and $0.01 per share, respectively.
72