Travelers 2012 Annual Report Download - page 107
Download and view the complete annual report
Please find page 107 of the 2012 Travelers annual report below. You can navigate through the pages in the report by either clicking on the pages listed below, or by using the keyword search tool below to find specific information within the annual report.-
 1
1 -
2
-
3
-
4
-
5
-
6
-
7
-
8
-
9
-
10
-
11
-
12
-
13
-
14
-
15
-
16
-
17
-
18
-
19
-
20
-
21
-
22
-
23
-
24
-
25
-
26
-
27
-
28
-
29
-
30
-
31
-
32
-
33
-
34
-
35
-
36
-
37
-
38
-
39
-
40
-
41
-
42
-
43
-
44
-
45
-
46
-
47
-
48
-
49
-
50
-
51
-
52
-
53
-
54
-
55
-
56
-
57
-
58
-
59
-
60
-
61
-
62
-
63
-
64
-
65
-
66
-
67
-
68
-
69
-
70
-
71
-
72
-
73
-
74
-
75
-
76
-
77
-
78
-
79
-
80
-
81
-
82
-
83
-
84
-
85
-
86
-
87
-
88
-
89
-
90
-
91
-
92
-
93
-
94
-
95
-
96
-
 97
97 -
 98
98 -
 99
99 -
 100
100 -
 101
101 -
 102
102 -
 103
103 -
 104
104 -
 105
105 -
 106
106 -
 107
107 -
 108
108 -
 109
109 -
 110
110 -
 111
111 -
 112
112 -
 113
113 -
 114
114 -
 115
115 -
 116
116 -
 117
117 -
118
-
119
-
120
-
121
-
122
-
123
-
124
-
125
-
126
-
127
-
128
-
129
-
130
-
131
-
132
-
133
-
134
-
135
-
136
-
137
-
138
-
139
-
140
-
141
-
142
-
143
-
144
-
145
-
146
-
147
-
148
-
149
-
150
-
151
-
152
-
153
-
154
-
155
-
156
-
157
-
158
-
159
-
160
-
161
-
162
-
163
-
164
-
165
-
166
-
167
-
168
-
169
-
170
-
171
-
172
-
173
-
174
-
175
-
176
-
177
-
178
-
179
-
180
-
181
-
182
-
183
-
184
-
185
-
186
-
187
-
188
-
189
-
190
-
191
-
192
-
193
-
194
-
195
-
196
-
197
-
198
-
199
-
200
-
201
-
202
-
203
-
204
-
205
-
206
-
207
-
208
-
209
-
210
-
211
-
212
-
213
-
214
-
215
-
216
-
217
-
218
-
219
-
220
-
221
-
222
-
223
-
224
-
225
-
226
-
227
-
228
-
229
-
230
-
231
-
232
-
233
-
234
-
235
-
236
-
237
-
238
-
239
-
240
-
241
-
242
-
243
-
244
-
245
-
246
-
247
-
248
-
249
-
250
-
251
-
252
-
253
-
254
-
255
-
256
-
257
-
258
-
259
-
260
-
261
-
262
-
263
-
264
-
265
-
266
-
267
-
268
-
269
-
270
-
271
-
272
-
273
-
274
-
275
-
276
-
277
-
278
-
279
-
280
-
281
-
282
-
283
-
284
-
285
-
286
-
287
-
288
-
289
-
290
-
291
-
292
-
293
-
294
-
295
-
296
-
297
-
298
-
299
-
300
 |
 |

account for the vast majority of policyholders with active asbestos-related claims, experienced a modest
reduction in gross asbestos-related payments during 2012 when compared with 2011, while net asbestos
payments were flat. Payments on behalf of policyholders in these categories continue to be influenced
by the high level of litigation activity in a limited number of jurisdictions where individuals alleging
serious asbestos-related injury continue to target previously peripheral defendants. The number of
policyholders tendering asbestos claims for the first time in 2012 and the number of policyholders with
open asbestos claims both increased slightly when compared with 2011.
The Company’s quarterly asbestos reserve reviews include an analysis of exposure and claim
payment patterns by policyholder category, as well as recent settlements, policyholder bankruptcies,
judicial rulings and legislative actions. The Company also analyzes developing payment patterns among
policyholders in the Home Office, Field Office and Assumed Reinsurance and Other categories as well
as projected reinsurance billings and recoveries. In addition, the Company reviews its historical gross
and net loss and expense paid experience, year-by-year, to assess any emerging trends, fluctuations, or
characteristics suggested by the aggregate paid activity. Conventional actuarial methods are not utilized
to establish asbestos reserves nor have the Company’s evaluations resulted in any way of determining a
meaningful average asbestos defense or indemnity payment.
The completion of these reviews and analyses in 2012, 2011 and 2010 resulted in $175 million,
$175 million and $140 million increases, respectively, in the Company’s net asbestos reserves in each
period. In each year, the reserve increases were primarily driven by increases in the Company’s
estimate of projected settlement and defense costs related to a broad number of policyholders in the
Home Office category and by higher projected payments on assumed reinsurance accounts. The
increase in the estimate of projected settlement and defense costs resulted from payment trends that
continue to be moderately higher than previously anticipated due to the impact of the current litigation
environment discussed above. The increase in 2010 also reflected increases in costs of litigating
asbestos-related coverage matters and was partially offset by a $70 million benefit from the reduction in
the allowance for uncollectible reinsurance resulting from a favorable ruling related to a reinsurance
dispute. Notwithstanding these trends, the Company’s overall view of the underlying asbestos
environment is essentially unchanged from recent periods, and there remains a high degree of
uncertainty with respect to future exposure to asbestos claims.
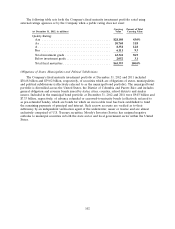
Net asbestos losses paid in 2012, 2011 and 2010 were $236 million, $284 million and $350 million,
respectively. Approximately 6%, 19% and 32% of total net paid losses in 2012, 2011 and 2010,
respectively, related to policyholders with whom the Company had entered into settlement agreements
limiting the Company’s liability.
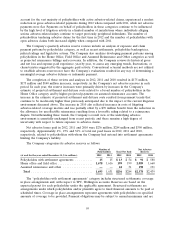
The Company categorizes its asbestos reserves as follows:
Number of Net Asbestos
Policyholders Total Net Paid Reserves
(at and for the year ended December 31, $ in millions) 2012 2011 2012 2011 2012 2011
Policyholders with settlement agreements .......... 15 15 $13 $54 $91$ 588
Home office and field office .................... 1,678 1,616 199 199 2,089 1,660
Assumed reinsurance and other ................. ——24 31 198 191
Total ................................... 1,693 1,631 $236 $284 $2,378 $2,439
The ‘‘policyholders with settlement agreements’’ category includes structured settlements, coverage
in place arrangements and, with respect to TPC, Wellington accounts. Reserves are based on the
expected payout for each policyholder under the applicable agreement. Structured settlements are
arrangements under which policyholders and/or plaintiffs agree to fixed financial amounts to be paid at
scheduled times. Coverage in place arrangements represent agreements with policyholders on specified
amounts of coverage to be provided. Payment obligations may be subject to annual maximums and are
95