Travelers 2012 Annual Report Download - page 20
Download and view the complete annual report
Please find page 20 of the 2012 Travelers annual report below. You can navigate through the pages in the report by either clicking on the pages listed below, or by using the keyword search tool below to find specific information within the annual report.-
 1
1 -
2
-
3
-
4
-
5
-
6
-
7
-
8
-
9
-
 10
10 -
 11
11 -
 12
12 -
 13
13 -
 14
14 -
 15
15 -
 16
16 -
 17
17 -
 18
18 -
 19
19 -
 20
20 -
 21
21 -
 22
22 -
 23
23 -
 24
24 -
 25
25 -
 26
26 -
 27
27 -
 28
28 -
 29
29 -
 30
30 -
31
-
32
-
33
-
34
-
35
-
36
-
37
-
38
-
39
-
40
-
41
-
42
-
43
-
44
-
45
-
46
-
47
-
48
-
49
-
50
-
51
-
52
-
53
-
54
-
55
-
56
-
57
-
58
-
59
-
60
-
61
-
62
-
63
-
64
-
65
-
66
-
67
-
68
-
69
-
70
-
71
-
72
-
73
-
74
-
75
-
76
-
77
-
78
-
79
-
80
-
81
-
82
-
83
-
84
-
85
-
86
-
87
-
88
-
89
-
90
-
91
-
92
-
93
-
94
-
95
-
96
-
97
-
98
-
99
-
100
-
101
-
102
-
103
-
104
-
105
-
106
-
107
-
108
-
109
-
110
-
111
-
112
-
113
-
114
-
115
-
116
-
117
-
118
-
119
-
120
-
121
-
122
-
123
-
124
-
125
-
126
-
127
-
128
-
129
-
130
-
131
-
132
-
133
-
134
-
135
-
136
-
137
-
138
-
139
-
140
-
141
-
142
-
143
-
144
-
145
-
146
-
147
-
148
-
149
-
150
-
151
-
152
-
153
-
154
-
155
-
156
-
157
-
158
-
159
-
160
-
161
-
162
-
163
-
164
-
165
-
166
-
167
-
168
-
169
-
170
-
171
-
172
-
173
-
174
-
175
-
176
-
177
-
178
-
179
-
180
-
181
-
182
-
183
-
184
-
185
-
186
-
187
-
188
-
189
-
190
-
191
-
192
-
193
-
194
-
195
-
196
-
197
-
198
-
199
-
200
-
201
-
202
-
203
-
204
-
205
-
206
-
207
-
208
-
209
-
210
-
211
-
212
-
213
-
214
-
215
-
216
-
217
-
218
-
219
-
220
-
221
-
222
-
223
-
224
-
225
-
226
-
227
-
228
-
229
-
230
-
231
-
232
-
233
-
234
-
235
-
236
-
237
-
238
-
239
-
240
-
241
-
242
-
243
-
244
-
245
-
246
-
247
-
248
-
249
-
250
-
251
-
252
-
253
-
254
-
255
-
256
-
257
-
258
-
259
-
260
-
261
-
262
-
263
-
264
-
265
-
266
-
267
-
268
-
269
-
270
-
271
-
272
-
273
-
274
-
275
-
276
-
277
-
278
-
279
-
280
-
281
-
282
-
283
-
284
-
285
-
286
-
287
-
288
-
289
-
290
-
291
-
292
-
293
-
294
-
295
-
296
-
297
-
298
-
299
-
300
 |
 |

vandalism, fires, explosions, terrorism and financial loss due to business interruption resulting
from covered property damage. For additional information on terrorism coverages, see
‘‘Reinsurance—Catastrophe Reinsurance—Terrorism Risk Insurance Program.’’ Property also
includes specialized equipment insurance, which provides coverage for loss or damage resulting
from the mechanical breakdown of boilers and machinery, and ocean and inland marine
insurance, which provides coverage for goods in transit and unique, one-of-a-kind exposures.
•General Liability. Insures businesses against third-party claims arising from accidents occurring
on their premises or arising out of their operations, including as a result of injuries sustained
from products sold. Specialized liability policies may also include coverage for directors’ and
officers’ liability arising in their official capacities, employment practices liability insurance,
fiduciary liability for trustees and sponsors of pension, health and welfare, and other employee
benefit plans, errors and omissions insurance for employees, agents, professionals and others
arising from acts or failures to act under specified circumstances, as well as umbrella and excess
insurance.
•Commercial Multi-Peril. Provides a combination of the property and liability coverages
described in the foregoing product line descriptions.
Net Retention Policy
The following discussion reflects the Company’s retention policy with respect to the Business
Insurance segment as of January 1, 2013. For third-party liability, Business Insurance generally limits its
net retention, through the use of reinsurance, to a maximum of $18.8 million per insured, per
occurrence. The net retained amount per risk for property exposures is generally limited to
$18.0 million per occurrence, after reinsurance. The Company generally retains its workers’
compensation exposures. Reinsurance treaties often have aggregate limits or caps which may result in
larger net per-risk retentions if the aggregate limits or caps are reached. The Company utilizes
facultative reinsurance to provide additional limits capacity or to reduce retentions on an individual risk
basis. The Company may also retain amounts greater than those described herein based upon the
individual characteristics of the risk.
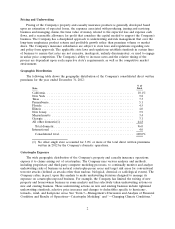
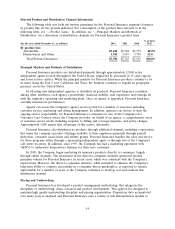
Geographic Distribution
The following table shows the geographic distribution of Business Insurance’s direct written
premiums for the states that accounted for the majority of premium volume for the year ended
December 31, 2012:
% of
State Total
California .................................................. 13.3%
New York ................................................. 7.7
Texas ..................................................... 7.5
Illinois .................................................... 5.0
Florida ................................................... 4.2
Pennsylvania ................................................ 4.1
New Jersey ................................................ 3.7
Massachusetts .............................................. 3.5
All others(1) ............................................... 51.0
Total ................................................... 100.0%
(1) No other single state accounted for 3.0% or more of the total direct written premiums
written in 2012 by the Business Insurance segment.
8