Travelers 2012 Annual Report Download - page 98
Download and view the complete annual report
Please find page 98 of the 2012 Travelers annual report below. You can navigate through the pages in the report by either clicking on the pages listed below, or by using the keyword search tool below to find specific information within the annual report.-
 1
1 -
2
-
3
-
4
-
5
-
6
-
7
-
8
-
9
-
10
-
11
-
12
-
13
-
14
-
15
-
16
-
17
-
18
-
19
-
20
-
21
-
22
-
23
-
24
-
25
-
26
-
27
-
28
-
29
-
30
-
31
-
32
-
33
-
34
-
35
-
36
-
37
-
38
-
39
-
40
-
41
-
42
-
43
-
44
-
45
-
46
-
47
-
48
-
49
-
50
-
51
-
52
-
53
-
54
-
55
-
56
-
57
-
58
-
59
-
60
-
61
-
62
-
63
-
64
-
65
-
66
-
67
-
68
-
69
-
70
-
71
-
72
-
73
-
74
-
75
-
76
-
77
-
78
-
79
-
80
-
81
-
82
-
83
-
84
-
85
-
86
-
87
-
 88
88 -
 89
89 -
 90
90 -
 91
91 -
 92
92 -
 93
93 -
 94
94 -
 95
95 -
 96
96 -
 97
97 -
 98
98 -
 99
99 -
 100
100 -
 101
101 -
 102
102 -
 103
103 -
 104
104 -
 105
105 -
 106
106 -
 107
107 -
 108
108 -
109
-
110
-
111
-
112
-
113
-
114
-
115
-
116
-
117
-
118
-
119
-
120
-
121
-
122
-
123
-
124
-
125
-
126
-
127
-
128
-
129
-
130
-
131
-
132
-
133
-
134
-
135
-
136
-
137
-
138
-
139
-
140
-
141
-
142
-
143
-
144
-
145
-
146
-
147
-
148
-
149
-
150
-
151
-
152
-
153
-
154
-
155
-
156
-
157
-
158
-
159
-
160
-
161
-
162
-
163
-
164
-
165
-
166
-
167
-
168
-
169
-
170
-
171
-
172
-
173
-
174
-
175
-
176
-
177
-
178
-
179
-
180
-
181
-
182
-
183
-
184
-
185
-
186
-
187
-
188
-
189
-
190
-
191
-
192
-
193
-
194
-
195
-
196
-
197
-
198
-
199
-
200
-
201
-
202
-
203
-
204
-
205
-
206
-
207
-
208
-
209
-
210
-
211
-
212
-
213
-
214
-
215
-
216
-
217
-
218
-
219
-
220
-
221
-
222
-
223
-
224
-
225
-
226
-
227
-
228
-
229
-
230
-
231
-
232
-
233
-
234
-
235
-
236
-
237
-
238
-
239
-
240
-
241
-
242
-
243
-
244
-
245
-
246
-
247
-
248
-
249
-
250
-
251
-
252
-
253
-
254
-
255
-
256
-
257
-
258
-
259
-
260
-
261
-
262
-
263
-
264
-
265
-
266
-
267
-
268
-
269
-
270
-
271
-
272
-
273
-
274
-
275
-
276
-
277
-
278
-
279
-
280
-
281
-
282
-
283
-
284
-
285
-
286
-
287
-
288
-
289
-
290
-
291
-
292
-
293
-
294
-
295
-
296
-
297
-
298
-
299
-
300
 |
 |
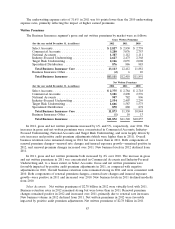
Earned premiums in 2011 were $3.17 billion, $143 million or 4% lower than in 2010. The decline
primarily reflected the impact of the termination of an exclusive broker relationship in the Republic of
Ireland, lower construction surety premium volumes over the preceding twelve months, intentional
underwriting actions undertaken in the Company’s operations at Lloyd’s intended to improve risk and
reward (particularly in the catastrophe-exposed lines of business) and competitive market conditions.
Earned premiums in 2011 benefited slightly from the favorable impact of foreign currency exchange
rates. In addition, earned premiums in 2010 benefited from the impact of a reduction in surety
reinsurance costs associated with prior year reinsurance treaties.
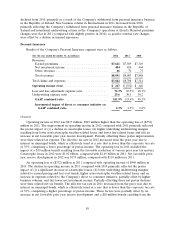
Net Investment Income
Net investment income in 2012 was $395 million, $19 million or 5% lower than in 2011, primarily
due to lower net investment income from fixed maturity investments, partially offset by higher net
investment income generated by non-fixed maturity investments. Net investment income in 2011 was
$414 million, $25 million or 6% lower than in 2010. Included in the Financial, Professional &
International Insurance segment are certain legal entities whose invested assets and related net
investment income are reported exclusively in this segment and not allocated among all business
segments. As a result, reported net investment income in the Financial, Professional & International
Insurance segment reflects a significantly smaller proportion of allocated net investment income,
including that from the Company’s non-fixed maturity investments that experienced an increase in
investment income in 2012 and 2011. Refer to the ‘‘Net Investment Income’’ section of the
‘‘Consolidated Results of Operations’’ discussion herein for a description of the factors contributing to
the changes in the Company’s consolidated net investment income in 2012 and 2011 compared with the
respective prior years. In addition, refer to note 2 of notes to the Company’s consolidated financial
statements herein for a discussion of the Company’s net investment income allocation methodology.
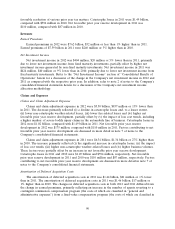
Claims and Expenses
Claims and Claim Adjustment Expenses
Claims and claim adjustment expenses in 2012 were $1.31 billion, $173 million or 12% lower than
in 2011, primarily reflecting (i) lower levels of large losses and (ii) the impact of lower construction
surety premium volumes and intentional underwriting actions as discussed above, partially offset by
(iii) a decline in net favorable prior year reserve development. Net favorable prior year reserve
development in 2012 was $298 million, compared with $360 million in 2011. Both Bond & Financial
Products and International contributed to net favorable prior year reserve development in 2012. Factors
contributing to net favorable prior year reserve development are discussed in more detail in note 7 of
notes to the Company’s consolidated financial statements. Catastrophe losses in 2012 were $50 million,
compared with $55 million in 2011.
Claims and claim adjustment expenses in 2011 were $1.49 billion, $213 million or 13% lower than
in 2010, primarily reflecting (i) an increase in net favorable prior year reserve development, (ii) a
decline in catastrophe losses, (iii) lower non-catastrophe weather-related losses and (iv) lower business
volume, partially offset by a higher level of large losses. Net favorable prior year reserve development
was $360 million and $259 million in 2011 and 2010, respectively. Factors contributing to net favorable
prior year reserve development are discussed in more detail in note 7 of notes to the Company’s
consolidated financial statements. Catastrophe losses in 2011 were $55 million, compared with $82
million in 2010.
Amortization of Deferred Acquisition Costs
The amortization of deferred acquisition costs in 2012 was $589 million, $14 million or 2% lower
than in 2011. The amortization of deferred acquisition costs was $603 million in 2011, $9 million or 1%
86