Travelers 2012 Annual Report Download - page 36
Download and view the complete annual report
Please find page 36 of the 2012 Travelers annual report below. You can navigate through the pages in the report by either clicking on the pages listed below, or by using the keyword search tool below to find specific information within the annual report.-
 1
1 -
2
-
3
-
4
-
5
-
6
-
7
-
8
-
9
-
10
-
11
-
12
-
13
-
14
-
15
-
16
-
17
-
18
-
19
-
20
-
21
-
22
-
23
-
24
-
25
-
 26
26 -
 27
27 -
 28
28 -
 29
29 -
 30
30 -
 31
31 -
 32
32 -
 33
33 -
 34
34 -
 35
35 -
 36
36 -
 37
37 -
 38
38 -
 39
39 -
 40
40 -
 41
41 -
 42
42 -
 43
43 -
 44
44 -
 45
45 -
 46
46 -
47
-
48
-
49
-
50
-
51
-
52
-
53
-
54
-
55
-
56
-
57
-
58
-
59
-
60
-
61
-
62
-
63
-
64
-
65
-
66
-
67
-
68
-
69
-
70
-
71
-
72
-
73
-
74
-
75
-
76
-
77
-
78
-
79
-
80
-
81
-
82
-
83
-
84
-
85
-
86
-
87
-
88
-
89
-
90
-
91
-
92
-
93
-
94
-
95
-
96
-
97
-
98
-
99
-
100
-
101
-
102
-
103
-
104
-
105
-
106
-
107
-
108
-
109
-
110
-
111
-
112
-
113
-
114
-
115
-
116
-
117
-
118
-
119
-
120
-
121
-
122
-
123
-
124
-
125
-
126
-
127
-
128
-
129
-
130
-
131
-
132
-
133
-
134
-
135
-
136
-
137
-
138
-
139
-
140
-
141
-
142
-
143
-
144
-
145
-
146
-
147
-
148
-
149
-
150
-
151
-
152
-
153
-
154
-
155
-
156
-
157
-
158
-
159
-
160
-
161
-
162
-
163
-
164
-
165
-
166
-
167
-
168
-
169
-
170
-
171
-
172
-
173
-
174
-
175
-
176
-
177
-
178
-
179
-
180
-
181
-
182
-
183
-
184
-
185
-
186
-
187
-
188
-
189
-
190
-
191
-
192
-
193
-
194
-
195
-
196
-
197
-
198
-
199
-
200
-
201
-
202
-
203
-
204
-
205
-
206
-
207
-
208
-
209
-
210
-
211
-
212
-
213
-
214
-
215
-
216
-
217
-
218
-
219
-
220
-
221
-
222
-
223
-
224
-
225
-
226
-
227
-
228
-
229
-
230
-
231
-
232
-
233
-
234
-
235
-
236
-
237
-
238
-
239
-
240
-
241
-
242
-
243
-
244
-
245
-
246
-
247
-
248
-
249
-
250
-
251
-
252
-
253
-
254
-
255
-
256
-
257
-
258
-
259
-
260
-
261
-
262
-
263
-
264
-
265
-
266
-
267
-
268
-
269
-
270
-
271
-
272
-
273
-
274
-
275
-
276
-
277
-
278
-
279
-
280
-
281
-
282
-
283
-
284
-
285
-
286
-
287
-
288
-
289
-
290
-
291
-
292
-
293
-
294
-
295
-
296
-
297
-
298
-
299
-
300
 |
 |

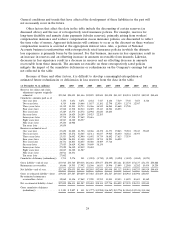
General conditions and trends that have affected the development of these liabilities in the past will
not necessarily recur in the future.
Other factors that affect the data in the table include the discounting of certain reserves (as
discussed above) and the use of retrospectively rated insurance policies. For example, reserves for
long-term disability and annuity claim payments (tabular reserves), primarily arising from workers’
compensation insurance and workers’ compensation excess insurance policies, are discounted to reflect
the time value of money. Apparent deficiencies will continue to occur as the discount on these workers’
compensation reserves is accreted at the appropriate interest rates. Also, a portion of National
Accounts business is underwritten with retrospectively rated insurance policies in which the ultimate
loss experience is primarily borne by the insured. For this business, increases in loss experience result in
an increase in reserves and an offsetting increase in amounts recoverable from insureds. Likewise,
decreases in loss experience result in a decrease in reserves and an offsetting decrease in amounts
recoverable from these insureds. The amounts recoverable on these retrospectively rated policies
mitigate the impact of the cumulative deficiencies or redundancies on the Company’s earnings but are
not reflected in the table.
Because of these and other factors, it is difficult to develop a meaningful extrapolation of
estimated future redundancies or deficiencies in loss reserves from the data in the table.
(at December 31, in millions) 2002 2003 2004 2005 2006 2007 2008 2009 2010 2011 2012
Reserves for claims and claim
adjustment expense originally
estimated ............... $23,268 $24,055 $41,446 $42,895 $42,844 $43,098 $41,312 $40,941 $40,255 $40,919 $40,634
Cumulative amounts paid as of
One year later ............ 5,170 4,651 8,871 8,632 7,417 8,146 7,519 7,748 7,653 8,326
Two years later ............ 8,319 8,686 14,666 13,837 13,181 12,798 12,454 12,374 12,567
Three years later .......... 11,312 11,541 18,733 18,466 16,545 16,264 15,668 15,708
Four years later ........... 13,548 13,708 22,514 21,025 19,113 18,524 18,053
Five years later ........... 15,229 15,574 24,572 22,992 20,820 44
Six years later ............ 16,836 16,624 26,189 24,423 22,205
Seven years later .......... 17,738 17,558 27,469 25,616
Eight years later ........... 18,563 18,320 28,557
Nine years later ........... 19,236 18,988
Ten years later ............ 19,854
Reserves re-estimated as of
One year later ............ 23,658 24,222 41,706 42,466 42,172 41,373 39,863 39,524 39,413 39,845
Two years later ............ 24,592 25,272 42,565 42,311 40,837 39,925 38,640 38,421 38,393
Three years later .......... 25,553 26,042 42,940 41,692 39,739 38,842 37,613 37,539
Four years later ........... 26,288 26,501 43,148 40,855 38,734 38,223 36,892
Five years later ........... 26,731 26,803 42,655 40,026 38,409 37,716
Six years later ............ 27,055 26,619 42,068 39,849 38,134
Seven years later .......... 27,022 26,342 42,019 39,694
Eight years later ........... 26,815 26,382 41,987
Nine years later ........... 26,911 26,431
Ten years later ............ 27,002
Cumulative deficiency (redundancy) 3,734 2,376 541 (3,201) (4,710) (5,382) (4,420) (3,402) (1,862) (1,074)
Gross liability—end of year ..... $33,914 $34,760 $59,438 $61,461 $59,677 $58,094 $55,121 $53,529 $51,537 $51,353 $50,888
Reinsurance recoverables ....... 10,646 10,705 17,992 18,566 16,833 14,996 13,809 12,588 11,282 10,434 10,254
Net liability—end of year ....... $23,268 $24,055 $41,446 $42,895 $42,844 $43,098 $41,312 $40,941 $40,255 $40,919 $40,634
Gross re-estimated liability—latest . $39,064 $37,587 $59,849 $57,684 $53,689 $51,527 $49,345 $48,964 $48,996 $50,007
Re-estimated reinsurance
recoverables—latest ......... 12,062 11,156 17,862 17,990 15,555 13,811 12,453 11,425 10,603 10,162
Net re-estimated liability—latest . . $27,002 $26,431 $41,987 $39,694 $38,134 $37,716 $36,892 $37,539 $38,393 $39,845
Gross cumulative deficiency
(redundancy) ............. $5,150 $ 2,827 $ 411 $ (3,777) $(5,988) $(6,567) $(5,776) $ (4,565) $ (2,541) $(1,346)
24
20,2