Travelers 2012 Annual Report Download - page 293
Download and view the complete annual report
Please find page 293 of the 2012 Travelers annual report below. You can navigate through the pages in the report by either clicking on the pages listed below, or by using the keyword search tool below to find specific information within the annual report.-
 1
1 -
2
-
3
-
4
-
5
-
6
-
7
-
8
-
9
-
10
-
11
-
12
-
13
-
14
-
15
-
16
-
17
-
18
-
19
-
20
-
21
-
22
-
23
-
24
-
25
-
26
-
27
-
28
-
29
-
30
-
31
-
32
-
33
-
34
-
35
-
36
-
37
-
38
-
39
-
40
-
41
-
42
-
43
-
44
-
45
-
46
-
47
-
48
-
49
-
50
-
51
-
52
-
53
-
54
-
55
-
56
-
57
-
58
-
59
-
60
-
61
-
62
-
63
-
64
-
65
-
66
-
67
-
68
-
69
-
70
-
71
-
72
-
73
-
74
-
75
-
76
-
77
-
78
-
79
-
80
-
81
-
82
-
83
-
84
-
85
-
86
-
87
-
88
-
89
-
90
-
91
-
92
-
93
-
94
-
95
-
96
-
97
-
98
-
99
-
100
-
101
-
102
-
103
-
104
-
105
-
106
-
107
-
108
-
109
-
110
-
111
-
112
-
113
-
114
-
115
-
116
-
117
-
118
-
119
-
120
-
121
-
122
-
123
-
124
-
125
-
126
-
127
-
128
-
129
-
130
-
131
-
132
-
133
-
134
-
135
-
136
-
137
-
138
-
139
-
140
-
141
-
142
-
143
-
144
-
145
-
146
-
147
-
148
-
149
-
150
-
151
-
152
-
153
-
154
-
155
-
156
-
157
-
158
-
159
-
160
-
161
-
162
-
163
-
164
-
165
-
166
-
167
-
168
-
169
-
170
-
171
-
172
-
173
-
174
-
175
-
176
-
177
-
178
-
179
-
180
-
181
-
182
-
183
-
184
-
185
-
186
-
187
-
188
-
189
-
190
-
191
-
192
-
193
-
194
-
195
-
196
-
197
-
198
-
199
-
200
-
201
-
202
-
203
-
204
-
205
-
206
-
207
-
208
-
209
-
210
-
211
-
212
-
213
-
214
-
215
-
216
-
217
-
218
-
219
-
220
-
221
-
222
-
223
-
224
-
225
-
226
-
227
-
228
-
229
-
230
-
231
-
232
-
233
-
234
-
235
-
236
-
237
-
238
-
239
-
240
-
241
-
242
-
243
-
244
-
245
-
246
-
247
-
248
-
249
-
250
-
251
-
252
-
253
-
254
-
255
-
256
-
257
-
258
-
259
-
260
-
261
-
262
-
263
-
264
-
265
-
266
-
267
-
268
-
269
-
270
-
271
-
272
-
273
-
274
-
275
-
276
-
277
-
278
-
279
-
280
-
281
-
282
-
 283
283 -
 284
284 -
 285
285 -
 286
286 -
 287
287 -
 288
288 -
 289
289 -
 290
290 -
 291
291 -
 292
292 -
 293
293 -
 294
294 -
 295
295 -
 296
296 -
 297
297 -
 298
298 -
 299
299 -
 300
300
 |
 |

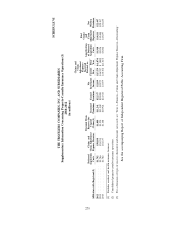
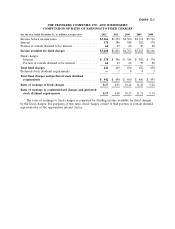
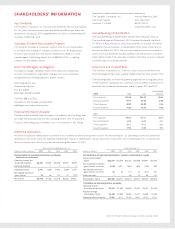
Exhibit 12.1
THE TRAVELERS COMPANIES, INC. AND SUBSIDIARIES
COMPUTATION OF RATIO OF EARNINGS TO FIXED CHARGES
(for the year ended December 31, in millions, except ratios) 2012 2011 2010 2009 2008
Income before income taxes ...................... $3,166 $1,352 $4,306 $4,711 $3,716
Interest ..................................... 378 386 388 382 370
Portion of rentals deemed to be interest .............. 64 63 68 70 80
Income available for fixed charges .................. $3,608 $1,801 $4,762 $5,163 $4,166
Fixed charges:
Interest .................................... $ 378 $ 386 $ 388 $ 382 $ 370
Portion of rentals deemed to be interest ............ 64 63 68 70 80
Total fixed charges ............................. 442 449 456 452 450
Preferred stock dividend requirements ............... —1445
Total fixed charges and preferred stock dividend
requirements ................................ $ 442 $ 450 $ 460 $ 456 $ 455
Ratio of earnings to fixed charges .................. 8.17 4.01 10.44 11.43 9.26
Ratio of earnings to combined fixed charges and preferred
stock dividend requirements ..................... 8.17 4.00 10.35 11.31 9.15
The ratio of earnings to fixed charges is computed by dividing income available for fixed charges
by the fixed charges. For purposes of this ratio, fixed charges consist of that portion of rentals deemed
representative of the appropriate interest factor.