Travelers 2012 Annual Report Download - page 122
Download and view the complete annual report
Please find page 122 of the 2012 Travelers annual report below. You can navigate through the pages in the report by either clicking on the pages listed below, or by using the keyword search tool below to find specific information within the annual report.-
 1
1 -
2
-
3
-
4
-
5
-
6
-
7
-
8
-
9
-
10
-
11
-
12
-
13
-
14
-
15
-
16
-
17
-
18
-
19
-
20
-
21
-
22
-
23
-
24
-
25
-
26
-
27
-
28
-
29
-
30
-
31
-
32
-
33
-
34
-
35
-
36
-
37
-
38
-
39
-
40
-
41
-
42
-
43
-
44
-
45
-
46
-
47
-
48
-
49
-
50
-
51
-
52
-
53
-
54
-
55
-
56
-
57
-
58
-
59
-
60
-
61
-
62
-
63
-
64
-
65
-
66
-
67
-
68
-
69
-
70
-
71
-
72
-
73
-
74
-
75
-
76
-
77
-
78
-
79
-
80
-
81
-
82
-
83
-
84
-
85
-
86
-
87
-
88
-
89
-
90
-
91
-
92
-
93
-
94
-
95
-
96
-
97
-
98
-
99
-
100
-
101
-
102
-
103
-
104
-
105
-
106
-
107
-
108
-
109
-
110
-
111
-
 112
112 -
 113
113 -
 114
114 -
 115
115 -
 116
116 -
 117
117 -
 118
118 -
 119
119 -
 120
120 -
 121
121 -
 122
122 -
 123
123 -
 124
124 -
 125
125 -
 126
126 -
 127
127 -
 128
128 -
 129
129 -
 130
130 -
 131
131 -
 132
132 -
133
-
134
-
135
-
136
-
137
-
138
-
139
-
140
-
141
-
142
-
143
-
144
-
145
-
146
-
147
-
148
-
149
-
150
-
151
-
152
-
153
-
154
-
155
-
156
-
157
-
158
-
159
-
160
-
161
-
162
-
163
-
164
-
165
-
166
-
167
-
168
-
169
-
170
-
171
-
172
-
173
-
174
-
175
-
176
-
177
-
178
-
179
-
180
-
181
-
182
-
183
-
184
-
185
-
186
-
187
-
188
-
189
-
190
-
191
-
192
-
193
-
194
-
195
-
196
-
197
-
198
-
199
-
200
-
201
-
202
-
203
-
204
-
205
-
206
-
207
-
208
-
209
-
210
-
211
-
212
-
213
-
214
-
215
-
216
-
217
-
218
-
219
-
220
-
221
-
222
-
223
-
224
-
225
-
226
-
227
-
228
-
229
-
230
-
231
-
232
-
233
-
234
-
235
-
236
-
237
-
238
-
239
-
240
-
241
-
242
-
243
-
244
-
245
-
246
-
247
-
248
-
249
-
250
-
251
-
252
-
253
-
254
-
255
-
256
-
257
-
258
-
259
-
260
-
261
-
262
-
263
-
264
-
265
-
266
-
267
-
268
-
269
-
270
-
271
-
272
-
273
-
274
-
275
-
276
-
277
-
278
-
279
-
280
-
281
-
282
-
283
-
284
-
285
-
286
-
287
-
288
-
289
-
290
-
291
-
292
-
293
-
294
-
295
-
296
-
297
-
298
-
299
-
300
 |
 |

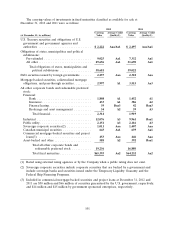
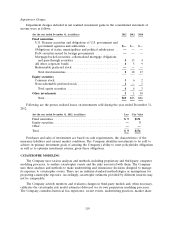
Impairment Charges
Impairment charges included in net realized investment gains in the consolidated statement of
income were as follows:
(for the year ended December 31, in millions) 2012 2011 2010
Fixed maturities
U.S. Treasury securities and obligations of U.S. government and
government agencies and authorities ................... $— $— $—
Obligations of states, municipalities and political subdivisions . . ———
Debt securities issued by foreign governments ............. ———
Mortgage-backed securities, collateralized mortgage obligations
and pass-through securities ......................... 413 4
All other corporate bonds ............................ 459
Redeemable preferred stock .......................... ———
Total fixed maturities .............................. 818 13
Equity securities
Common stock .................................... 362
Non-redeemable preferred stock ....................... 1—1
Total equity securities ............................. 463
Other investments ................................... 3110
Total .......................................... $15 $25 $26
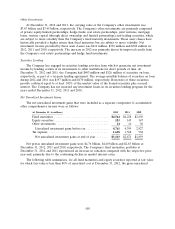
Following are the pretax realized losses on investments sold during the year ended December 31,
2012:
(for the year ended December 31, 2012, in millions) Loss Fair Value
Fixed maturities ...................................... $ 9 $171
Equity securities ...................................... —5
Other .............................................. ——
Total .............................................. $ 9 $176
Purchases and sales of investments are based on cash requirements, the characteristics of the
insurance liabilities and current market conditions. The Company identifies investments to be sold to
achieve its primary investment goals of assuring the Company’s ability to meet policyholder obligations
as well as to optimize investment returns, given these obligations.
CATASTROPHE MODELING
The Company uses various analyses and methods, including proprietary and third-party computer
modeling processes, to analyze catastrophic events and the risks associated with them. The Company
uses these analyses and methods to make underwriting and reinsurance decisions designed to manage
its exposure to catastrophic events. There are no industry-standard methodologies or assumptions for
projecting catastrophe exposure. Accordingly, catastrophe estimates provided by different insurers may
not be comparable.
The Company actively monitors and evaluates changes in third-party models and, when necessary,
calibrates the catastrophe risk model estimates delivered via its own proprietary modeling processes.
The Company considers historical loss experience, recent events, underwriting practices, market share
110