Travelers 2012 Annual Report Download - page 140
Download and view the complete annual report
Please find page 140 of the 2012 Travelers annual report below. You can navigate through the pages in the report by either clicking on the pages listed below, or by using the keyword search tool below to find specific information within the annual report.-
 1
1 -
2
-
3
-
4
-
5
-
6
-
7
-
8
-
9
-
10
-
11
-
12
-
13
-
14
-
15
-
16
-
17
-
18
-
19
-
20
-
21
-
22
-
23
-
24
-
25
-
26
-
27
-
28
-
29
-
30
-
31
-
32
-
33
-
34
-
35
-
36
-
37
-
38
-
39
-
40
-
41
-
42
-
43
-
44
-
45
-
46
-
47
-
48
-
49
-
50
-
51
-
52
-
53
-
54
-
55
-
56
-
57
-
58
-
59
-
60
-
61
-
62
-
63
-
64
-
65
-
66
-
67
-
68
-
69
-
70
-
71
-
72
-
73
-
74
-
75
-
76
-
77
-
78
-
79
-
80
-
81
-
82
-
83
-
84
-
85
-
86
-
87
-
88
-
89
-
90
-
91
-
92
-
93
-
94
-
95
-
96
-
97
-
98
-
99
-
100
-
101
-
102
-
103
-
104
-
105
-
106
-
107
-
108
-
109
-
110
-
111
-
112
-
113
-
114
-
115
-
116
-
117
-
118
-
119
-
120
-
121
-
122
-
123
-
124
-
125
-
126
-
127
-
128
-
129
-
 130
130 -
 131
131 -
 132
132 -
 133
133 -
 134
134 -
 135
135 -
 136
136 -
 137
137 -
 138
138 -
 139
139 -
 140
140 -
 141
141 -
 142
142 -
 143
143 -
 144
144 -
 145
145 -
 146
146 -
 147
147 -
 148
148 -
 149
149 -
 150
150 -
151
-
152
-
153
-
154
-
155
-
156
-
157
-
158
-
159
-
160
-
161
-
162
-
163
-
164
-
165
-
166
-
167
-
168
-
169
-
170
-
171
-
172
-
173
-
174
-
175
-
176
-
177
-
178
-
179
-
180
-
181
-
182
-
183
-
184
-
185
-
186
-
187
-
188
-
189
-
190
-
191
-
192
-
193
-
194
-
195
-
196
-
197
-
198
-
199
-
200
-
201
-
202
-
203
-
204
-
205
-
206
-
207
-
208
-
209
-
210
-
211
-
212
-
213
-
214
-
215
-
216
-
217
-
218
-
219
-
220
-
221
-
222
-
223
-
224
-
225
-
226
-
227
-
228
-
229
-
230
-
231
-
232
-
233
-
234
-
235
-
236
-
237
-
238
-
239
-
240
-
241
-
242
-
243
-
244
-
245
-
246
-
247
-
248
-
249
-
250
-
251
-
252
-
253
-
254
-
255
-
256
-
257
-
258
-
259
-
260
-
261
-
262
-
263
-
264
-
265
-
266
-
267
-
268
-
269
-
270
-
271
-
272
-
273
-
274
-
275
-
276
-
277
-
278
-
279
-
280
-
281
-
282
-
283
-
284
-
285
-
286
-
287
-
288
-
289
-
290
-
291
-
292
-
293
-
294
-
295
-
296
-
297
-
298
-
299
-
300
 |
 |

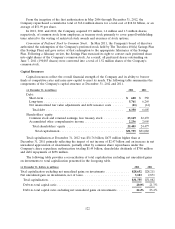
For further discussion of the pension and other postretirement benefit plans, see note 14 of notes
to the consolidated financial statements.
Risk-Based Capital
The NAIC has Risk-Based Capital (RBC) requirements for property casualty companies to be
used as minimum capital requirements by the NAIC and states to identify companies that merit further
regulatory action. The formulas have not been designed to differentiate among adequately capitalized
companies that operate with levels of capital above the RBC requirements. Therefore, it is
inappropriate and ineffective to use the formulas to rate or to rank these companies. At December 31,
2012, all of the Company’s insurance subsidiaries had adjusted capital in excess of amounts requiring
any company or regulatory action.
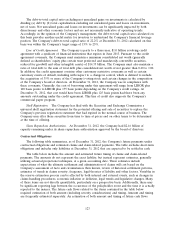
Off-Balance Sheet Arrangements
The Company has entered into certain contingent obligations for guarantees related to the sale of
business entities, certain investments, third-party loans related to certain investments, certain insurance
policy obligations of former insurance subsidiaries and various other indemnifications. See note 16 of
notes to the Company’s consolidated financial statements. The Company does not expect these
arrangements will have a material effect on the Company’s financial position, changes in financial
position, revenues and expenses, results of operations, liquidity, capital expenditures or capital
resources.
CRITICAL ACCOUNTING ESTIMATES
The Company considers its most significant accounting estimates to be those applied to claims and
claim adjustment expense reserves and related reinsurance recoverables, investment valuation and
impairments, and goodwill and other intangible assets impairments.
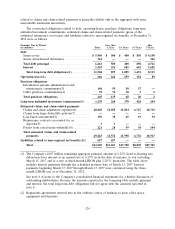
Claims and Claim Adjustment Expense Reserves
Gross claims and claim adjustment expense reserves by product line were as follows:
2012 2011
(at December 31, in millions) Case IBNR Total Case IBNR Total
General liability .................... $ 5,525 $ 9,109 $14,634 $ 5,571 $ 9,657 $15,228
Commercial property ................ 992 638 1,630 1,025 643 1,668
Commercial multi-peril .............. 2,018 1,723 3,741 2,153 1,792 3,945
Commercial automobile .............. 2,343 1,241 3,584 2,388 1,121 3,509
Workers’ compensation .............. 9,684 7,589 17,273 9,649 7,348 16,997
Fidelity and surety .................. 479 934 1,413 500 1,029 1,529
Personal automobile ................ 1,980 722 2,702 2,038 736 2,774
Homeowners and personal—other ...... 1,335 809 2,144 778 814 1,592
International and other .............. 2,216 1,551 3,767 2,370 1,741 4,111
Property-casualty ................. 26,572 24,316 50,888 26,472 24,881 51,353
Accident and health ................. 34—3439—39
Claims and claim adjustment expense
reserves ...................... $26,606 $24,316 $50,922 $26,511 $24,881 $51,392
The $470 million decrease in gross claims and claim adjustment expense reserves since
December 31, 2011 primarily reflected the impact of net favorable prior year reserve development and
payments related to significant catastrophe losses incurred in 2011 as well as operations in runoff
128