Travelers 2012 Annual Report Download - page 119
Download and view the complete annual report
Please find page 119 of the 2012 Travelers annual report below. You can navigate through the pages in the report by either clicking on the pages listed below, or by using the keyword search tool below to find specific information within the annual report.-
 1
1 -
2
-
3
-
4
-
5
-
6
-
7
-
8
-
9
-
10
-
11
-
12
-
13
-
14
-
15
-
16
-
17
-
18
-
19
-
20
-
21
-
22
-
23
-
24
-
25
-
26
-
27
-
28
-
29
-
30
-
31
-
32
-
33
-
34
-
35
-
36
-
37
-
38
-
39
-
40
-
41
-
42
-
43
-
44
-
45
-
46
-
47
-
48
-
49
-
50
-
51
-
52
-
53
-
54
-
55
-
56
-
57
-
58
-
59
-
60
-
61
-
62
-
63
-
64
-
65
-
66
-
67
-
68
-
69
-
70
-
71
-
72
-
73
-
74
-
75
-
76
-
77
-
78
-
79
-
80
-
81
-
82
-
83
-
84
-
85
-
86
-
87
-
88
-
89
-
90
-
91
-
92
-
93
-
94
-
95
-
96
-
97
-
98
-
99
-
100
-
101
-
102
-
103
-
104
-
105
-
106
-
107
-
108
-
 109
109 -
 110
110 -
 111
111 -
 112
112 -
 113
113 -
 114
114 -
 115
115 -
 116
116 -
 117
117 -
 118
118 -
 119
119 -
 120
120 -
 121
121 -
 122
122 -
 123
123 -
 124
124 -
 125
125 -
 126
126 -
 127
127 -
 128
128 -
 129
129 -
130
-
131
-
132
-
133
-
134
-
135
-
136
-
137
-
138
-
139
-
140
-
141
-
142
-
143
-
144
-
145
-
146
-
147
-
148
-
149
-
150
-
151
-
152
-
153
-
154
-
155
-
156
-
157
-
158
-
159
-
160
-
161
-
162
-
163
-
164
-
165
-
166
-
167
-
168
-
169
-
170
-
171
-
172
-
173
-
174
-
175
-
176
-
177
-
178
-
179
-
180
-
181
-
182
-
183
-
184
-
185
-
186
-
187
-
188
-
189
-
190
-
191
-
192
-
193
-
194
-
195
-
196
-
197
-
198
-
199
-
200
-
201
-
202
-
203
-
204
-
205
-
206
-
207
-
208
-
209
-
210
-
211
-
212
-
213
-
214
-
215
-
216
-
217
-
218
-
219
-
220
-
221
-
222
-
223
-
224
-
225
-
226
-
227
-
228
-
229
-
230
-
231
-
232
-
233
-
234
-
235
-
236
-
237
-
238
-
239
-
240
-
241
-
242
-
243
-
244
-
245
-
246
-
247
-
248
-
249
-
250
-
251
-
252
-
253
-
254
-
255
-
256
-
257
-
258
-
259
-
260
-
261
-
262
-
263
-
264
-
265
-
266
-
267
-
268
-
269
-
270
-
271
-
272
-
273
-
274
-
275
-
276
-
277
-
278
-
279
-
280
-
281
-
282
-
283
-
284
-
285
-
286
-
287
-
288
-
289
-
290
-
291
-
292
-
293
-
294
-
295
-
296
-
297
-
298
-
299
-
300
 |
 |
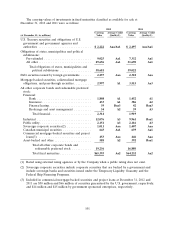
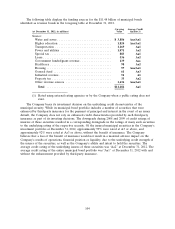
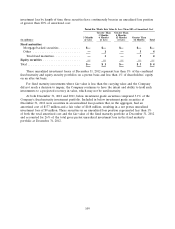
interest rate ranges. Included in the totals at December 31, 2012 and 2011 were $1.44 billion and
$1.82 billion, respectively, of GNMA, FNMA and FHLMC (excluding FHA project loans) guaranteed
residential mortgage-backed pass-through securities classified as available for sale. Also included in
those totals were residential CMOs classified as available for sale with a fair value of $1.56 billion and
$1.70 billion, at December 31, 2012 and 2011, respectively. Approximately 43% and 38% of the
Company’s CMO holdings at December 31, 2012 and 2011, respectively, were guaranteed by or fully
collateralized by securities issued by GNMA, FNMA or FHLMC. The average credit rating of the
$893 million and $1.05 billion of non-guaranteed CMO holdings at December 31, 2012 and 2011,
respectively, was ‘‘B2’’ and ‘‘Ba1,’’ respectively. The average credit rating of all of the above securities
was ‘‘A1’’ and ‘‘Aa3’’ at December 31, 2012 and 2011, respectively.
The Company makes investments in residential CMOs that are either guaranteed by GNMA,
FNMA or FHLMC, or if not guaranteed, are senior or super-senior positions within their respective
securitizations. Both guaranteed and non-guaranteed residential CMOs allocate the distribution of
payments from the underlying mortgages among different classes of bondholders. In addition,
non-guaranteed residential CMOs provide structures that allocate the impact of credit losses to
different classes of bondholders. Senior and super-senior CMOs are protected, to varying degrees, from
credit losses as those losses are initially allocated to subordinated bondholders. The Company’s
investment strategy is to purchase CMO tranches that are expected to offer the most favorable return
given the Company’s assessment of associated risks. The Company does not purchase residual interests
in CMOs.
Alternative Documentation Mortgages and Sub-Prime Mortgages
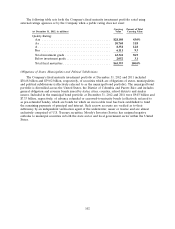
At December 31, 2012 and 2011, the ‘‘mortgage-backed securities, collateralized mortgage
obligations and pass-through securities’’ and ‘‘asset-backed and other’’ categories in the foregoing table
included collateralized mortgage obligations backed by alternative documentation mortgages and asset-
backed securities collateralized by sub-prime mortgages with a collective fair value of $347 million and
$351 million, respectively (comprising less than 1% of the Company’s total fixed maturity investments
at both dates). The continued disruption in secondary investment markets provided the Company with
the opportunity to selectively acquire additional mortgage-backed securities at discounted prices in
recent years. The Company purchased $11 million and $128 million of such securities in the years
ended December 31, 2012 and 2011, respectively. The Company defines sub-prime mortgage-backed
securities as investments in which the underlying loans primarily exhibit one or more of the following
characteristics: low FICO scores, above-prime interest rates, high loan-to-value ratios or high
debt-to-income ratios. Alternative documentation securitizations are those in which the underlying loans
primarily meet the government-sponsored entities’ requirements for credit score but do not meet the
government-sponsored entities’ guidelines for documentation, property type, debt and loan-to-value
ratios. The average credit rating on these securities and obligations held by the Company was ‘‘Ba1’’
and ‘‘Baa2’’ at December 31, 2012 and 2011, respectively.
Commercial Mortgage-Backed Securities and Project Loans
At December 31, 2012 and 2011, the Company held commercial mortgage-backed securities
(including FHA project loans) of $453 million and $446 million, respectively. The Company does not
believe this portfolio exposes it to a material adverse impact on its results of operations, financial
position or liquidity, due to the portfolio’s relatively small size and the underlying credit strength of
these securities.
Equity Securities Available for Sale, Real Estate and Short-Term Investments
See note 1 of notes to the Company’s consolidated financial statements for further information
about these invested asset classes.
107