Travelers 2012 Annual Report Download - page 197
Download and view the complete annual report
Please find page 197 of the 2012 Travelers annual report below. You can navigate through the pages in the report by either clicking on the pages listed below, or by using the keyword search tool below to find specific information within the annual report.-
 1
1 -
2
-
3
-
4
-
5
-
6
-
7
-
8
-
9
-
10
-
11
-
12
-
13
-
14
-
15
-
16
-
17
-
18
-
19
-
20
-
21
-
22
-
23
-
24
-
25
-
26
-
27
-
28
-
29
-
30
-
31
-
32
-
33
-
34
-
35
-
36
-
37
-
38
-
39
-
40
-
41
-
42
-
43
-
44
-
45
-
46
-
47
-
48
-
49
-
50
-
51
-
52
-
53
-
54
-
55
-
56
-
57
-
58
-
59
-
60
-
61
-
62
-
63
-
64
-
65
-
66
-
67
-
68
-
69
-
70
-
71
-
72
-
73
-
74
-
75
-
76
-
77
-
78
-
79
-
80
-
81
-
82
-
83
-
84
-
85
-
86
-
87
-
88
-
89
-
90
-
91
-
92
-
93
-
94
-
95
-
96
-
97
-
98
-
99
-
100
-
101
-
102
-
103
-
104
-
105
-
106
-
107
-
108
-
109
-
110
-
111
-
112
-
113
-
114
-
115
-
116
-
117
-
118
-
119
-
120
-
121
-
122
-
123
-
124
-
125
-
126
-
127
-
128
-
129
-
130
-
131
-
132
-
133
-
134
-
135
-
136
-
137
-
138
-
139
-
140
-
141
-
142
-
143
-
144
-
145
-
146
-
147
-
148
-
149
-
150
-
151
-
152
-
153
-
154
-
155
-
156
-
157
-
158
-
159
-
160
-
161
-
162
-
163
-
164
-
165
-
166
-
167
-
168
-
169
-
170
-
171
-
172
-
173
-
174
-
175
-
176
-
177
-
178
-
179
-
180
-
181
-
182
-
183
-
184
-
185
-
186
-
 187
187 -
 188
188 -
 189
189 -
 190
190 -
 191
191 -
 192
192 -
 193
193 -
 194
194 -
 195
195 -
 196
196 -
 197
197 -
 198
198 -
 199
199 -
 200
200 -
 201
201 -
 202
202 -
 203
203 -
 204
204 -
 205
205 -
 206
206 -
 207
207 -
208
-
209
-
210
-
211
-
212
-
213
-
214
-
215
-
216
-
217
-
218
-
219
-
220
-
221
-
222
-
223
-
224
-
225
-
226
-
227
-
228
-
229
-
230
-
231
-
232
-
233
-
234
-
235
-
236
-
237
-
238
-
239
-
240
-
241
-
242
-
243
-
244
-
245
-
246
-
247
-
248
-
249
-
250
-
251
-
252
-
253
-
254
-
255
-
256
-
257
-
258
-
259
-
260
-
261
-
262
-
263
-
264
-
265
-
266
-
267
-
268
-
269
-
270
-
271
-
272
-
273
-
274
-
275
-
276
-
277
-
278
-
279
-
280
-
281
-
282
-
283
-
284
-
285
-
286
-
287
-
288
-
289
-
290
-
291
-
292
-
293
-
294
-
295
-
296
-
297
-
298
-
299
-
300
 |
 |

THE TRAVELERS COMPANIES, INC. AND SUBSIDIARIES
NOTES TO CONSOLIDATED FINANCIAL STATEMENTS (Continued)
3. INVESTMENTS (Continued)
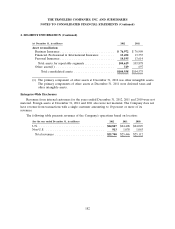
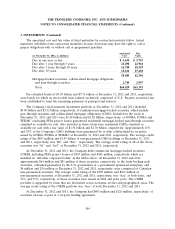
Proceeds from sales of fixed maturities classified as available for sale were $1.09 billion,
$1.16 billion and $3.71 billion in 2012, 2011 and 2010, respectively. Gross gains of $70 million,
$63 million and $106 million and gross losses of $9 million, $10 million and $11 million were realized
on sales and other fixed maturity-related transactions (excluding impairments) in 2012, 2011 and 2010,
respectively.
At December 31, 2012 and 2011, the Company’s insurance subsidiaries had $4.94 billion and
$4.70 billion, respectively, of securities on deposit at financial institutions in certain states pursuant to
the respective states’ insurance regulatory requirements. Funds deposited with third parties to be used
as collateral to secure various liabilities on behalf of insureds, cedants and other creditors had a fair
value of $68 million and $90 million at December 31, 2012 and 2011, respectively. Other investments
pledged as collateral securing outstanding letters of credit had a fair value of $56 million and
$59 million at December 31, 2012 and 2011, respectively.
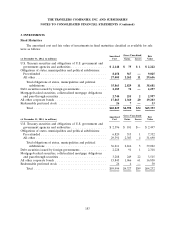
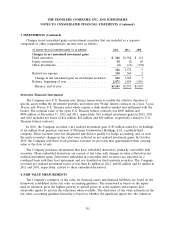
Equity Securities
The cost and fair value of investments in equity securities were as follows:
Gross
Unrealized Fair
(at December 31, 2012, in millions) Cost Gains Losses Value
Common stock ........................................... $366 $148 $ 4 $510
Non-redeemable preferred stock .............................. 96 39 — 135
Total ................................................. $462 $187 $ 4 $645
Gross
Unrealized Fair
(at December 31, 2011, in millions) Cost Gains Losses Value
Common stock ........................................... $311 $120 $3 $428
Non-redeemable preferred stock .............................. 103 29 1 131
Total ................................................. $414 $149 $4 $559
Proceeds from sales of equity securities were $37 million, $135 million and $201 million in 2012,
2011 and 2010, respectively. Gross gains of $8 million, $48 million and $128 million and gross realized
losses of less than $1 million, $2 million and less than $1 million were realized on those sales
(excluding impairments) in 2012, 2011 and 2010, respectively. In 2010, proceeds from the sales of equity
securities and gross gains realized on those sales included $115 million and $102 million, respectively,
from the sale of substantially all of the Company’s remaining common stock holdings in Verisk
Analytics, Inc. (Verisk), a portion of which was classified as an equity security at the time of sale.
In 2010, the Company also sold a portion of its investment in Verisk that was classified as an
‘‘other investment’’ at the time of sale due to transfer restrictions that were scheduled to expire after
one year. Proceeds from that sale of Verisk shares in 2010 were $115 million. Gross gains realized on
that sale were $103 million.
185